Chapter 7. Perfmon2—Hardware-Based Performance Monitoring
Contents
Perfmon2 is a standardized, generic interface to access the performance monitoring unit (PMU) of a processor. It is portable across all PMU models and architectures, supports system-wide and per-thread monitoring, counting and sampling.
7.1. Conceptual Overview
The following subsections give you a brief overview about Perfmon.
7.1.1. Perfmon2 Structure
Performance monitoring is “the action of collecting information related to how an application or system performs”. The information can be obtained from the code or the CPU/chipset.
Modern processors contain a performance monitoring unit (PMU). The design and functionality of a PMU is CPU specific: for example, the number of registers, counters and features supported will vary by CPU implementation.
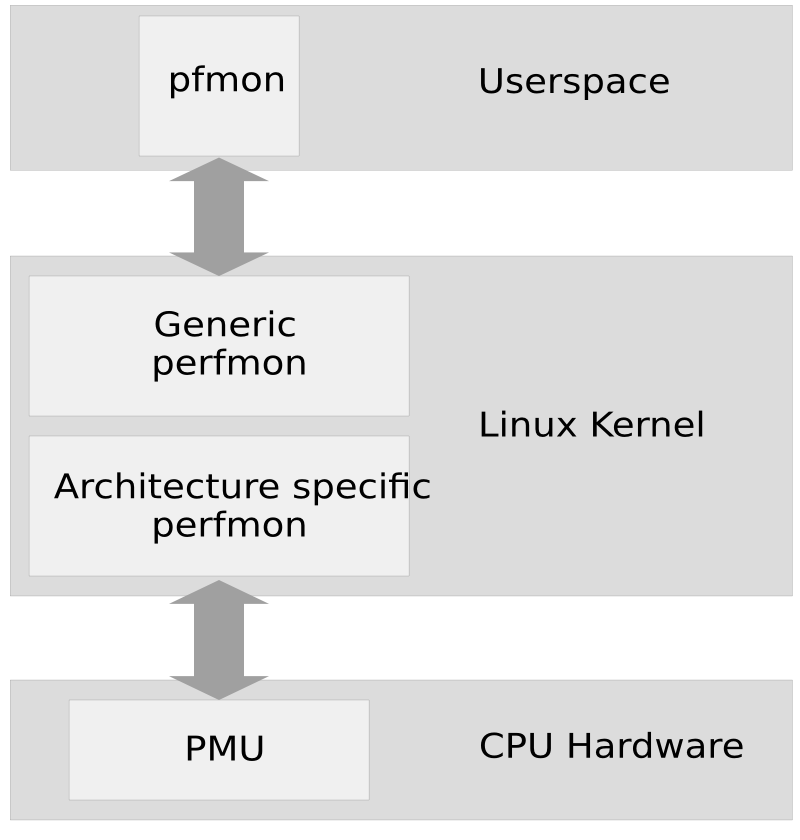
The Perfmon interface is designed to be generic, flexible and extensible. It can monitor at the program (thread) or system levels. In either mode, it is possible to count or sample your profile information. This uniformity makes it easier to write portable tools. Figure 7.1, “Architecture of perfmon2” gives an overview.
Each PMU model consists of a set of registers: the performance monitor configuration (PMC) and the performance monitor data (PMD). Only PMCs is writeable, but both can be read. These registers store configuration information and data.
7.1.2. Sampling and Counting
Perfmon2 supports two modes where you can run your profiling: sampling or couting.
Sampling is usually expressed by an interval of
time (time-based) or an occurance of a definied number of events
(event-based). Perfmon indirectly supports time-based sampling by using
an event-based sample with constant correlation to time (for example,
unhalted_reference_cycles.)
In contrast, Counting is expressed in terms of a number of occurances of an event.
Both methods store their information into a sample. This sample contains information about, for example, where a thread was or instruction pointers.
The following example demonstrates the counting of the
CPU_OP_CYCLES event and the sampling of this event,
generating a sample per 100000 occurances of the event:
pfmon --no-cmd-output -e CPU_OP_CYCLES_ALL /bin/ls
1306604 CPU_OP_CYCLES_ALL
The following command gives the count of a specific function and the procentual amount of the total cycles:
pfmon --no-cmd-output --short-smpl-periods=100000   -e CPU_OP_CYCLES_ALL /bin/ls
# results for [28119:28119<-[28102]] (/bin/ls)
# total samples          : 12
# total buffer overflows : 0
#
#                   event00
#     counts   %self    %cum          code addr
           1   8.33%   8.33% 0x2000000000007180
           1   8.33%  16.67% 0x20000000000195a0
           1   8.33%  25.00% 0x2000000000019260
           1   8.33%  33.33% 0x2000000000014e60
           1   8.33%  41.67% 0x20000000001f38c0
           1   8.33%  50.00% 0x20000000001ea481
           1   8.33%  58.33% 0x200000000020b260
           1   8.33%  66.67% 0x2000000000203490
           1   8.33%  75.00% 0x2000000000203360
           1   8.33%  83.33% 0x2000000000203440
           1   8.33%  91.67% 0x4000000000002690
           1   8.33% 100.00% 0x20000000001cfdf1
7.2. Installation
In order to use Perfmon2, first check the following preconditions:
- SUSE Linux Enterprise 11
Supported architectures are IA64, x86_64. The package
perf(Performance Counters for Linux) is the supported tool for x86 and PPC64- SUSE Linux Enterprise 11 SP1
Supported architecture is IA64 only
The pfmon on SUSE Linux Enterprise11 supports the following processors
(taken from /usr/share/doc/packages/pfmon/README):
Table 7.1. Supported Processors
|
Model |
Processor |
|---|---|
|
Intel IA-64 |
Itanium (Merced), Itanium 2 (McKinley, Madison, Deerfield), Itanium 2 9000/9100 (Montecito, Montvale) and Generic |
|
AMD X86 |
Opteron (K8, fam 10h) |
|
Intel X86 |
Intel P6 (Pentium II, Pentium Pro, Pentium III, Pentium M); Yonah (Core Duo, Core Solo); Netburst (Pentium 4, Xeon); Core (Merom, Penryn, Dunnington) Core 2 and Quad; Atom; Nehalem; architectural perfmon v1, v2, v3 |
Install the following packages depending on your architecture:
7.3. Using Perfmon
In order to use Perfmon, use the command line tool pfmon to get all your information.
![[Note]](admon/note.png) | Mutual Exclusion of Perfmon and OProfile Sessions |
|---|---|
On x86 architectures it is not possible to start a Perfmon session and a OProfile session. Only one can be run at the same time. | |
7.3.1. Getting Event Information
To get a list of supported events, use the option -l
from pfmon to list them. Keep in mind, this list
depends on the host PMU:
pfmon -l
ALAT_CAPACITY_MISS_ALL
ALAT_CAPACITY_MISS_FP
ALAT_CAPACITY_MISS_INT
BACK_END_BUBBLE_ALL
BACK_END_BUBBLE_FE
BACK_END_BUBBLE_L1D_FPU_RSE
...
CPU_CPL_CHANGES_ALL
CPU_CPL_CHANGES_LVL0
CPU_CPL_CHANGES_LVL1
CPU_CPL_CHANGES_LVL2
CPU_CPL_CHANGES_LVL3
CPU_OP_CYCLES_ALL
CPU_OP_CYCLES_QUAL
CPU_OP_CYCLES_HALTED
DATA_DEBUG_REGISTER_FAULT
DATA_DEBUG_REGISTER_MATCHES
DATA_EAR_ALAT
...
Get an explanation of these entries with the option -i
and the event name:
pfmon -i CPU_OP_CYCLES_ALL
Name     : CPU_OP_CYCLES_ALL
Code     : 0x12
Counters : [ 4 5 6 7 8 9 10 11 12 13 14 15 ]
Desc     : CPU Operating Cycles -- All CPU cycles counted
Umask    : 0x0
EAR      : None
ETB      : No
MaxIncr  : 1  (Threshold 0)
Qual     : None
Type     : Causal
Set      : None
7.3.2. Enabling System Wide Sessions
Use the --system-wide option to enable monitoring all
processes that execute on a specific CPU or sets of CPUs. You do not
have to be root to do so; per default, user level is turned on for
all events (option -u).
It is possible that one system wide session can run concurrently with another system wide sessions as long as they do not monitor the same set of CPUs. However, you can not run a system wide session with any per-thread sessions together.
The following examples are taken from a Itanium IA64 Montecito processor. To execute a system-wide session, perform the following procedure:
Detect your CPU set:
pfmon -v --system-wide
...
selected CPUs (2 CPU in set, 2 CPUs online): CPU0 CPU1
Delimit your session. The following list describes options which are used in the examples below (refer to the man page for more details):
-e/--eventsProfile only selected events. See Section 7.3.1, “Getting Event Information” for how to get a list.
--cpu-listSpecifies the list of processors to monitor. Without this options, all available processors are monitored.
-t/--session-timeoutSpecifies the duration of the monitor session expressed in seconds.
Use one of the three methods to start your profile session.
Use the default events:
pfmon --cpu-list=0-2 --system-wide -k -e CPU_OP_CYCLES_ALL,IA64_INST_RETIRED
<press ENTER to stop session>
CPU0                       7670609 CPU_OP_CYCLES_ALL
CPU0                       4380453 IA64_INST_RETIRED
CPU1                       7061159 CPU_OP_CYCLES_ALL
CPU1                       4143020 IA64_INST_RETIRED
CPU2                       7194110 CPU_OP_CYCLES_ALL
CPU2                       4168239 IA64_INST_RETIRED
Use a timeout expressed in seconds:
pfmon --cpu-list=0-2 --system-wide --session-timeout=10 -k -e CPU_OP_CYCLES_ALL,IA64_INST_RETIRED
<session to end in 10 seconds>
CPU0                      69263547 CPU_OP_CYCLES_ALL
CPU0                      38682141 IA64_INST_RETIRED
CPU1                      87189093 CPU_OP_CYCLES_ALL
CPU1                      54684852 IA64_INST_RETIRED
CPU2                      64441287 CPU_OP_CYCLES_ALL
CPU2                      37883915 IA64_INST_RETIRED
Execute a command. The session is automatically started when the program starts and automatically stopped when the program is finished:
pfmon --cpu-list=0-1 --system-wide -u -e CPU_OP_CYCLES_ALL,IA64_INST_RETIRED -- ls -l /dev/null
crw-rw-rw- 1 root root 1, 3 27. Mär 03:30 /dev/null
CPU0                         38925 CPU_OP_CYCLES_ALL
CPU0                          7510 IA64_INST_RETIRED
CPU1                          9825 CPU_OP_CYCLES_ALL
CPU1                          1676 IA64_INST_RETIRED
Press the key to stop a session:
If you want to aggregate counts, use the
-aggroption after the previous command:pfmon --cpu-list=0-1 --system-wide -u -e CPU_OP_CYCLES_ALL,IA64_INST_RETIRED --aggr <press ENTER to stop session> 52655 CPU_OP_CYCLES_ALL 53164 IA64_INST_RETIRED
7.3.3. Monitoring Running Tasks
Perfmon can also monitor an existing thread. This is useful for monitoring system daemons or programs which take a long time to start. First determine the process ID you wish to monitor:
ps ax | grep foo
10027  pts/1    R     2:23  foo
Use the found PID for the --attach-task option of
pfmon:
pfmon --attach-task=10027
3682190 CPU_OP_CYCLES_ALL
7.4. Retrieving Metrics From DebugFS
Perfmon can collect statistics which are exported through the debug interface. The metrics consists of mostly aggregated counts and durations.
Access the data through mounting the debug file system as root
under /sys/kernel/debug
The data is located under /sys/kernel/debug/perfmon/
and organized per CPU. Each CPU contains a set of metrics, accessible as
ASCII file. The following data is taken from the
/usr/src/linux/Documentation/perfmon2-debugfs.txt:
Table 7.3. Read-Only Files in /sys/kernel/debug/perfmon/cpu*/
|
File |
Description |
|---|---|
|
|
Number of PMU context switch in |
|
|
Number of nanoseconds spent in the PMU context switch in routine Average cost of the PMU context switch in = ctxswin_ns / ctxswin_count |
|
|
Number of PMU context switch out |
|
|
Number of nanoseconds spend in the PMU context switch out routine Average cost of the PMU context switch out = ctxswout_ns / ctxswout_count |
|
|
Number of calls to the sampling format routine that handles PMU interrupts (typically the routine that recors a sample) |
|
|
Number of nanoseconds spent in the routine that handle PMU interrupt in the sampling format Average time spent in this routine = fmt_handler_ns / fmt_handler_calls |
|
|
Number of times the |
|
|
Number of times |
|
|
Number of PMU interrupts received by the kernel |
|
|
Number of non maskeable interrupts (NMI) received by the kernel from perfmon (only for X86 hardware) |
|
|
Number of nanoseconds spent in the perfmon2 PMU interrupt handler routine. Average time to handle one PMU interrupt = ovfl_intr_ns / ovfl_intr_all_count |
|
|
Number of PMU interrupts which are actually processed by the perfmon interrupt handler |
|
|
Number of PMU interrupts which were replayed on the context switch in or on event set switching |
|
|
Number of PMU interrupts which were dropped because there was no active context |
|
|
Number of times |
|
|
Number of times |
|
|
Number of event set switches |
|
|
Number of nanoseconds spent in the set switching rountine Average cost of switching sets = set_switch_ns / set_switch_count |
This might be useful to compare your metrics before and after the perfmon run. For example, collect your data first:
for i in /sys/kernel/debug/perfmon/cpu0/*; do
   echo "$i:"; cat $i
done >> pfmon-before.txt
Run your performance monitoring, maybe restrict it to a specific CPU:
pfmon --cpu-list=0 ...
Collect your data again:
for i in /sys/kernel/debug//perfmon/cpu0/*; do
   echo "$i:"; cat $i
done >> pfmon-after.txt
Compare these two files:
diff -u pfmon-before.txt pfmon-after.txt
7.5. For More Information
This chapter only provides a short overview. Refer to the following links for more information:
- http://perfmon2.sourceforge.net/
The project home page.
- http://www.iop.org/EJ/article/1742-6596/119/4/042017/jpconf8_119_042017.pdf
A good overview as PDF.
- Chapter 8, OProfile—System-Wide Profiler
Consult this chapter for other performance optimizations.