Chapter 8. OProfile—System-Wide Profiler
Contents
OProfile is a profiler for dynamic program analysis. It investigates the behavior of a running program and gathers information. This information can be viewed and gives hints for further optimizations.
It is not necessary to recompile or use wrapper libraries in order to use OProfile. Not even a kernel patch is needed. Usually, when you profile an application, a small overhead is expected, depending on work load and sampling frequency.
8.1. Conceptual Overview
OProfile consists of a kernel driver and a daemon for collecting data. It makes use of the hardware performance counters provided on Intel, AMD, and other processors. OProfile is capable of profiling all code including the kernel, kernel modules, kernel interrupt handlers, system shared libraries, and other applications.
Modern processors support profiling through the hardware by performance counters. Depending on the processor, there can be many counters and each of these can be programmed with an event to count. Each counter has a value which determines how often a sample is taken. The lower the value, the more often it is used.
During the post-processing step, all information is collected and instruction addresses are mapped to a function name.
8.2. Installation and Requirements
In order to make use of OProfile, install the
oprofile package. OProfile works
on IA-64, AMD64, s390, and PPC64.
It is useful to install the respective debuginfo
package for the respective application you want to profile. If you want
to profile the Kernel, you need the debuginfo
package as well.
8.3. Available OProfile Utilities
OProfile contains several utilities to handle the profiling process and its profiled data. The following list is a short summary of processes used in this chapter:
- opannotate
Outputs annotated source or assembly listings mixed with profile information.
- opcontrol
Controls the profiling sessions (start or stop), dumps profile data, and sets up parameters.
- ophelp
Lists available events with short descriptions.
- opimport
Converts sample database files from a foreign binary format to the native format.
- opreport
Generates reports from profiled data.
8.4. Using OProfile
It is possible with OProfile to profile both kernel and applications. When
profiling the kernel, tell OProfile where to find the
vmlinuz* file. Use the --vmlinux
option and point it to vmlinuz* (usually in
/boot). If you need to profile kernel modules,
OProfile does this by default. However, make sure you read
http://oprofile.sourceforge.net/doc/kernel-profiling.html.
Applications usually do not need to profile the kernel, so better use the
--no-vmlinux option to reduce the amount of information.
8.4.1. General Steps
In its simplest form, start the daemon, collect data, stop the daemon, and create your report. This method is described in detail in the following procedure:
Open a shell and log in as
root.Decide if you want to profile with or without the Linux kernel:
Profile With the Linux Kernel. Execute the following commands, because the opcontrol command needs an uncompressed image:
cp /boot/vmlinux-`uname -r`.gz /tmp
gunzip /tmp/vmlinux*.gz
opcontrol --vmlinux=/tmp/vmlinux*
Profile Without the Linux Kernel. Use the following command:
opcontrol --no-vmlinux
If you want to see which functions call other functions in the output, use additionally the
--callgraphoption:opcontrol --no-vmlinux --callgraph
Start the OProfile daemon:
opcontrol --start
Using 2.6+ OProfile kernel interface.
Using log file /var/lib/oprofile/samples/oprofiled.log
Daemon started.
Profiler running.
Start your application you want to profile right after the previous step.
Stop the OProfile daemon:
opcontrol --stop
Dump the collected data to
/var/lib/oprofile/samples:opcontrol --dump
Create a report:
opreport
Overflow stats not available
CPU: CPU with timer interrupt, speed 0 MHz (estimated)
Profiling through timer interrupt
          TIMER:0|
  samples|      %|
------------------
    84877 98.3226 no-vmlinux
...
Shutdown the OProfile daemon:
opcontrol --shutdown
8.4.2. Getting Event Configurations
The general procedure for event configuration is as follows:
Use first the events
CPU-CLK_UNHALTEDandINST_RETIREDto find optimization opportunities.Use specific events to find bottlenecks. To list them, use the command opcontrol
--list-events.
If you need to profile certain events, first check the available events supported by your processor with the ophelp command (example output generated from Intel Core i5 CPU):
ophelp
oprofile: available events for CPU type "Intel Architectural Perfmon"

See Intel 64 and IA-32 Architectures Software Developer's Manual
Volume 3B (Document 253669) Chapter 18 for architectural perfmon events
This is a limited set of fallback events because oprofile doesn't know your CPU
CPU_CLK_UNHALTED: (counter: all))
        Clock cycles when not halted (min count: 6000)
INST_RETIRED: (counter: all))
        number of instructions retired (min count: 6000)
LLC_MISSES: (counter: all))
        Last level cache demand requests from this core that missed the LLC (min count: 6000)
        Unit masks (default 0x41)
        ----------
        0x41: No unit mask
LLC_REFS: (counter: all))
        Last level cache demand requests from this core (min count: 6000)
        Unit masks (default 0x4f)
        ----------
        0x4f: No unit mask
BR_MISS_PRED_RETIRED: (counter: all))
        number of mispredicted branches retired (precise) (min count: 500)
You can get the same output from opcontrol
--list-events.
Specify the performance counter events with the option
--event. Multiple options are possible. This option
needs an event name (from ophelp) and a sample rate,
for example:
opcontrol --event=CPU_CLK_UNHALTED:100000
![[Warning]](admon/warning.png) | Be Careful with Low Sampling Rates with CPU_CLK_UNHALTED |
|---|---|
Setting sampling rates is dangerous as small rates cause the system to overload and freeze. | |
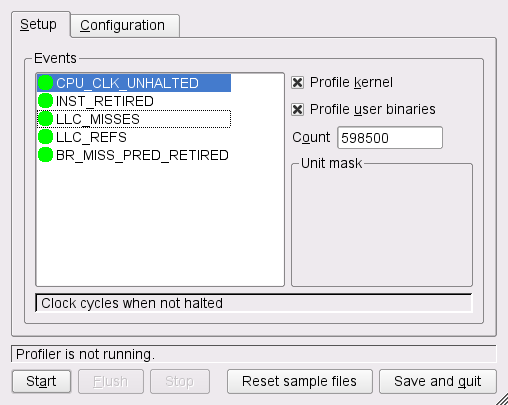
8.5. Using OProfile's GUI
The GUI for OProfile can be started as root with
oprof_start, see
Figure 8.1, “GUI for OProfile”. Select your events and change the
counter, if necessary. Every highlighted line is added to the list of
checked events. Use the tab to set the
buffer and CPU size, the verbose option and others. Click on
to execute OProfile.
8.6. Generating Reports
Before generating a report, make sure OProfile has dumped your data to the
/var/lib/oprofile/samples directory using the
command opcontrol --dump. A report
can be generated with the commands opreport or
opannotate.
Calling oreport without any options gives a complete
summary. With an executable as an argument, retrieve profile data only
from this executable. If you analyze applications written in C++, use the
--demangle smart option.
The opannotate generates output with annotations from source code. Run it with the following options:
opannotate --source \ --base-dirs=BASEDIR\ --search-dirs=\ --output-dir=annotated/ \ /lib/libfoo.so
The option --base-dir contains a comma separated list of
paths which is stripped from debug source files. This paths were searched
prior than looking in --search-dirs. The
--search-dirs option is also a comma separated list of
directories to search for source files.
![[Note]](admon/note.png) | Inaccuracies in Annotated Source |
|---|---|
Due to compiler optimization, code can disappear and appear in a different place. Use the information in http://oprofile.sourceforge.net/doc/debug-info.html to fully understand its implications. | |
8.7. For More Information
This chapter only provides a short overview. Refer to the following links for more information:
- http://oprofile.sourceforge.net
The project home page.
- Manpages
Details descriptions about the options of the different tools.
/usr/share/doc/packages/oprofile/oprofile.htmlContains the OProfile manual.
- http://developer.intel.com/
Architecture reference for Intel processors.
- http://www.amd.com/us-en/assets/content_type/white_papers_and_tech_docs/22007.pdf
Architecture reference for AMD Athlon/Opteron/Phenom/Turion.
- http://www-01.ibm.com/chips/techlib/techlib.nsf/productfamilies/PowerPC/
Architecture reference for PowerPC64 processors in IBM iSeries, pSeries, and blade server systems.