Chapter 2. System Monitoring Utilities
Contents
There are number of programs, tools, and utilities which you can use to examine the status of your system. This chapter introduces some of them and describes their most important and frequently used parameters.
For each of the described commands, examples of the relevant outputs are
presented. In the examples, the first line is the command itself (after
the > or # sign prompt). Omissions are indicated with square brackets
([...]) and long lines are wrapped where necessary.
Line breaks for long lines are indicated by a backslash
(\).
# command -x -y
output line 1
output line 2
output line 3 is annoyingly long, so long that \
    we have to break it
output line 3
[...]
output line 98
output line 99
The descriptions have been kept short so that we can include as many
utilities as possible. Further information for all the commands can be
found in the manual pages. Most of the commands also understand the
parameter --help, which produces a brief list of possible
parameters.
2.1. Multi-Purpose Tools
While most of the Linux system monitoring tools are specific to monitor a certain aspect of the system, there are a few “swiss army knife” tools showing various aspects of the system at a glance. Use these tools first in order to get an overview and find out which part of the system to examine further.
2.1.1. vmstat
vmstat collects information about processes, memory, I/O, interrupts and CPU. If called without a sampling rate, it displays average values since the last reboot. When called with a sampling rate, it displays actual samples:
Example 2.1. vmstat Output on a Lightly Used Machine
tux@mercury:~> vmstat -a 2
procs -----------memory---------- ---swap-- -----io---- -system-- -----cpu-------
 r  b   swpd   free  inact active   si   so    bi    bo   in   cs us sy  id wa st
 0  0      0 750992 570648 548848    0    0     0     1    8    9  0  0 100  0  0
 0  0      0 750984 570648 548912    0    0     0     0   63   48  1  0 99   0  0
 0  0      0 751000 570648 548912    0    0     0     0   55   47  0  0 100  0  0
 0  0      0 751000 570648 548912    0    0     0     0   56   50  0  0 100  0  0
 0  0      0 751016 570648 548944    0    0     0     0   57   50  0  0 100  0  0
Example 2.2. vmstat Output on a Heavily Used Machine (CPU bound)
tux@mercury:~> vmstat 2
procs -----------memory----------- ---swap-- -----io---- -system-- -----cpu------
 r  b   swpd   free   buff   cache   si   so    bi    bo   in   cs us sy id wa st
32  1  26236 459640 110240 6312648    0    0  9944     2 4552 6597 95  5  0  0  0
23  1  26236 396728 110336 6136224    0    0  9588     0 4468 6273 94  6  0  0  0
35  0  26236 554920 110508 6166508    0    0  7684 27992 4474 4700 95  5  0  0  0
28  0  26236 518184 110516 6039996    0    0 10830     4 4446 4670 94  6  0  0  0
21  5  26236 716468 110684 6074872    0    0  8734 20534 4512 4061 96  4  0  0  0
![[Tip]](admon/tip.png) | |
The first line of the vmstat output always displays average values since the last reboot. | |
The columns show the following:
Shows the amount of processes in the run queue. These processes are waiting for a free CPU slot to be executed. If the number of processes in this column is constantly higher than the number of CPUs available, this is an indication for insufficient CPU power.
Shows the amount of processes waiting for a resource other than a CPU. A high number in this column may indicate an I/O problem (network or disk).
The amount of swap space (KB) currently used.
The amount of unused memory (KB).
Recently unused memory that can be reclaimed. This column is only visible when calling vmstat with the parameter
-a(recommended).Recently used memory that normally does not get reclaimed. This column is only visible when calling vmstat with the parameter
-a(recommended).File buffer cache (KB) in RAM. This column is not visible when calling vmstat with the parameter
-a(recommended).Page cache (KB) in RAM. This column is not visible when calling vmstat with the parameter
-a(recommended).Page cache (KB) in RAM. This column is not visible when calling vmstat with the parameter
-a(recommended).Amount of data (KB) that is moved from RAM to swap per second. High values over a longer period of time in this column are an indication that the machine would benefit from more RAM.
Amount of data (KB) that is moved from swap to RAM per second. High values over a longer period of time in this column are an indication that the machine would benefit from more RAM.
Number of blocks per second received from a block device (e.g. a disk read). Note that swapping also impacts the values shown here.
Number of blocks per second sent to a block device (e.g. a disk write). Note that swapping also impacts the values shown here.
Interrupts per second. A high value indicates a high I/O level (network and/or disk).
Number of context switches per second. Simplified this means that the kernel has to replace executable code of one program in memory with that of another program.
Percentage of CPU usage from user processes.
Percentage of CPU usage from system processes.
Percentage of CPU time spent idling. If this value is zero over a longer period of time, your CPU(s) are working to full capacity. This is not necessarily a bad sign—rather refer to the values in columns and to determine if your machine is equipped with sufficient CPU power.
If "wa" time is non-zero, it indicates throughput lost due to waiting for I/O. This may be inevitable, for example, if a file is being read for the first time, background writeback cannot keep up, and so on. It can also be an indicator for a hardware bottleneck (network or hard disk). A last, it can indicate a potential for tuning the virtual memory manager (refer to Chapter 15, Tuning the Memory Management Subsystem).
Percentage of CPU time used by virtual machines.
See vmstat --help for more options.
2.1.2. System Activity Information: sar and sadc
sar can generate extensive reports on almost all
important system activities, among them CPU, memory, IRQ usage, IO, or
networking. It can either generate reports on the fly or query existing
reports gathered by the system activity data collector
(sadc). sar and
sadc both gather all their data from the
/proc file system.
![[Note]](admon/note.png) | sysstat Package |
|---|---|
sar and sadc are part of
| |
2.1.2.1. Automatically Collecting Daily Statistics With sadc
If you want to monitor your system about a longer period of time, use
sadc to automatically collect the data. You can read
this data at any time using sar. To start
sadc, simply run /etc/init.d/boot.sysstat
start. This will add a link to
/etc/cron.d/ that calls sadc
with the following default configuration:
All available data will be collected.
Data is written to
/var/log/sa/sa, whereDDDDstands for the current day. If a file already exists, it will be archived.The summary report is written to
/var/log/sa/sar, whereDDDDstands for the current day. Already existing files will be archived.Data is collected every ten minutes, a summary report is generated every 6 hours (see /etc/sysstat/sysstat.cron).
The data is collected by the
/usr/lib64/sa/sa1script (or/usr/lib/sa/sa1on 32bit systems)The summaries are generated by the script
/usr/lib64/sa/sa2(or/usr/lib/sa/sa2on 32bit systems)
If you need to customize the configuration, copy the
sa1 and sa2 scripts and
adjust them according to your needs. Replace the link
/etc/cron.d/sysstat with a customized copy of
/etc/sysstat/sysstat.cron calling your scripts.
2.1.2.2. Generating reports with sar
To generate reports on the fly, call sar with an
interval (seconds) and a count. To generate reports from files specify
a filename with the option -f instead of interval and
count. If filename, interval and count are not specified,
sar attempts to generate a report from
/var/log/sa/sa, where
DDDD stands for the current day. This is the
default location to where sadc writes its data.
Query multiple files with multiple -f options.
sar 2 10                         # on-the-fly report, 10 times every 2 seconds
sar -f ~/reports/sar_2010_05_03  # queries file sar_2010_05_03
sar                              # queries file from today in /var/log/sa/
cd /var/log/sa &&\
sar -f sa01 -f sa02              # queries files /var/log/sa/0[12]
Find examples for useful sar calls and their
interpretation below. For detailed information on the meaning of each
column, please refer to the man (1) of
sar. Also refer to the man page for more options and
reports—sar offers plenty of them.
2.1.2.2.1. CPU Utilization Report: sar
When called with no options, sar shows a basic
report about CPU usage. On multi-processor machines, results for all
CPUs are summarized. Use the option -P ALL to also
see statistics for individual CPUs.
mercury:~ # sar 10 5
Linux 2.6.31.12-0.2-default (mercury) 03/05/10   _x86_64_   (2 CPU)

14:15:43   CPU    %user   %nice   %system   %iowait    %steal     %idle
14:15:53   all    38.55    0.00      6.10      0.10      0.00     55.25
14:16:03   all    12.59    0.00      4.90      0.33      0.00     82.18
14:16:13   all    56.59    0.00      8.16      0.44      0.00     34.81
14:16:23   all    58.45    0.00      3.00      0.00      0.00     38.55
14:16:33   all    86.46    0.00      4.70      0.00      0.00      8.85
Average:   all    49.94    0.00      5.38      0.18      0.00     44.50
If the value for (percentage of the CPU being idle while waiting for I/O) is significantly higher than zero over a longer period of time, there is a bottleneck in the I/O system (network or hard disk). If the value is zero over a longer period of time, your CPU(s) are working to full capacity.
2.1.2.2.2. Memory Usage Report: sar -r
Generate an overall picture of the system memory (RAM) by using the
option -r:
mercury:~ # sar -r 10 5
Linux 2.6.31.12-0.2-default (mercury) 03/05/10   _x86_64_   (2 CPU)

16:12:12 kbmemfree kbmemused %memused kbbuffers kbcached kbcommit %commit
16:12:22    548188   1507488    73.33     20524    64204  2338284   65.10
16:12:32    259320   1796356    87.39     20808    72660  2229080   62.06
16:12:42    381096   1674580    81.46     21084    75460  2328192   64.82
16:12:52    642668   1413008    68.74     21392    81212  1938820   53.98
16:13:02    311984   1743692    84.82     21712    84040  2212024   61.58
Average:    428651   1627025    79.15     21104    75515  2209280   61.51
The last two columns ( and ) show an approximation of the total amount of memory (RAM plus swap) the current workload would need in the worst case (in kilobyte or percent respectively).
2.1.2.2.3. Paging Statistics Report: sar -B
Use the option -B to display the kernel paging
statistics.
mercury:~ # sar -B 10 5
Linux 2.6.31.12-0.2-default (mercury) 03/05/10   _x86_64_   (2 CPU)

16:11:43 pgpgin/s pgpgout/s   fault/s majflt/s  pgfree/s pgscank/s pgscand/s pgsteal/s  %vmeff
16:11:53   225.20    104.00  91993.90     0.00  87572.60      0.00      0.00      0.00    0.00
16:12:03   718.32    601.00  82612.01     2.20  99785.69    560.56    839.24   1132.23   80.89
16:12:13  1222.00   1672.40 103126.00     1.70 106529.00   1136.00    982.40   1172.20   55.33
16:12:23   112.18     77.84 113406.59     0.10  97581.24     35.13    127.74    159.38   97.86
16:12:33   817.22     81.28 121312.91     9.41 111442.44      0.00      0.00      0.00    0.00
Average:   618.72    507.20 102494.86     2.68 100578.98    346.24    389.76    492.60   66.93
The (major faults per second) column shows how many pages are loaded from disk (swap) into memory. A large number of major faults slows down the system and is an indication of insufficient main memory. The column shows the number of pages scanned () in relation to the ones being reused from the main memory cache or the swap cache (). It is a measurement of the efficiency of page reclaim. Healthy values are either near 100 (every inactive page swapped out is being reused) or 0 (no pages have been scanned). The value should not drop below 30.
2.1.2.2.4. Block Device Statistics Report: sar -d
Use the option -d to display the block device (hdd,
optical drive, USB storage device, ...). Make sure to use the
additional option -p (pretty-print) to make the
column readable.
mercury:~ # sar -d -p 10 5
Linux 2.6.31.12-0.2-default (neo) 	03/05/10 	_x86_64_	(2 CPU)

16:28:31  DEV    tps  rd_sec/s  wr_sec/s  avgrq-sz  avgqu-sz  await  svctm  %util
16:28:41  sdc  11.51     98.50    653.45     65.32      0.10   8.83   4.87   5.61
16:28:41 scd0   0.00      0.00      0.00      0.00      0.00   0.00   0.00   0.00

16:28:41  DEV    tps  rd_sec/s  wr_sec/s  avgrq-sz  avgqu-sz  await  svctm  %util
16:28:51  sdc  15.38    329.27    465.93     51.69      0.10   6.39   4.70   7.23
16:28:51 scd0   0.00      0.00      0.00      0.00      0.00   0.00   0.00   0.00

16:28:51  DEV    tps rd_sec/s  wr_sec/s  avgrq-sz  avgqu-sz  await  svctm  %util
16:29:01  sdc  32.47   876.72    647.35     46.94      0.33  10.20   3.67  11.91
16:29:01 scd0   0.00     0.00      0.00      0.00      0.00   0.00   0.00   0.00

16:29:01  DEV    tps rd_sec/s  wr_sec/s  avgrq-sz  avgqu-sz  await  svctm  %util
16:29:11  sdc  48.75  2852.45    366.77     66.04      0.82  16.93   4.91  23.94
16:29:11 scd0   0.00     0.00      0.00      0.00      0.00   0.00   0.00   0.00

16:29:11  DEV    tps rd_sec/s  wr_sec/s  avgrq-sz  avgqu-sz  await  svctm  %util
16:29:21  sdc  13.20   362.40    412.00     58.67      0.16  12.03   6.09   8.04
16:29:21 scd0   0.00     0.00      0.00      0.00      0.00   0.00   0.00   0.00

Average:  DEV    tps rd_sec/s  wr_sec/s  avgrq-sz  avgqu-sz  await  svctm  %util
Average:  sdc  24.26   903.52    509.12     58.23      0.30  12.49   4.68  11.34
Average: scd0   0.00     0.00      0.00      0.00      0.00   0.00   0.00   0.00
If your machine uses multiple disks, you will receive the best performance, if I/O requests are evenly spread over all disks. Compare the values for , , and of all disks. Constantly high values in the and columns could be an indication that the amount of free space on the disk is insufficient.
2.1.2.2.5. Network Statistics Reports: sar -n KEYWORD
KEYWORD
The option -n lets you generate multiple network
related reports. Specify one of the following keywords along with the
-n:
DEV: Generates a statistic report for all network devices
EDEV: Generates an error statistics report for all network devices
NFS: Generates a statistic report for an NFS client
NFSD: Generates a statistic report for an NFS server
SOCK: Generates a statistic report on sockets
ALL: Generates all network statistic reports
2.1.2.3. Visualizing sar Data
sar reports are not always easy to parse for humans. kSar, a Java application visualizing your sar data, creates easy-to-read graphs. It can even generate PDF reports. kSar takes data generated on the fly as well as past data from a file. kSar is licensed under the BSD license and is available from http://ksar.atomique.net/.
2.2. System Information
2.2.1. Device Load Information: iostat
iostat monitors the system device loading. It generates reports that can be useful for better balancing the load between physical disks attached to your system.
The first iostat report shows statistics collected since the system was booted. Subsequent reports cover the time since the previous report.
tux@mercury:~> iostat
Linux 2.6.32.7-0.2-default (geeko@buildhost) 	02/24/10 	_x86_64_

avg-cpu:  %user   %nice %system %iowait  %steal   %idle
           0,49    0,01    0,10    0,31    0,00   99,09

Device:            tps   Blk_read/s   Blk_wrtn/s   Blk_read   Blk_wrtn
sda               1,34         5,59        25,37    1459766    6629160
sda1              0,00         0,01         0,00       1519          0
sda2              0,87         5,11        17,83    1335365    4658152
sda3              0,47         0,47         7,54     122578    1971008
When invoked with the -n option,
iostat adds statistics of network file systems (NFS)
load. The option -x shows extended statistics
information.
You can also specify which device should be monitored at what time
intervals. For example, iostat -p sda 3
5 will display five reports at three second intervals for
device sda.
| sysstat Package |
|---|---|
iostat is part of sysstat package. To use it,
install the package with | |
2.2.2. Processor Activity Monitoring: mpstat
The utility mpstat examines activities of each available processor. If your system has one processor only, the global average statistics will be reported.
With the -P option, you can specify the number of
processors to be reported (note that 0 is the first processor). The
timing arguments work the same way as with the iostat
command. Entering mpstat -P 1 2 5
prints five reports for the second processor (number 1) at 2 second
intervals.
tux@mercury:~> mpstat -P 1 2 5
Linux 2.6.32.7-0.2-default (geeko@buildhost) 	02/24/10 	_x86_64_

08:57:10  CPU    %usr   %nice    %sys %iowait    %irq   %soft  %steal  \
 %guest   %idle
08:57:12    1    4.46    0.00    5.94    0.50    0.00    0.00    0.00  \
 0.00   89.11
08:57:14    1    1.98    0.00    2.97    0.99    0.00    0.99    0.00  \
 0.00   93.07
08:57:16    1    2.50    0.00    3.00    0.00    0.00    1.00    0.00  \
 0.00   93.50
08:57:18    1   14.36    0.00    1.98    0.00    0.00    0.50    0.00  \
 0.00   83.17
08:57:20    1    2.51    0.00    4.02    0.00    0.00    2.01    0.00  \
 0.00   91.46
Average:    1    5.17    0.00    3.58    0.30    0.00    0.90    0.00  \
 0.00   90.05
2.2.3. Task Monitoring: pidstat
If you need to see what load a particular task applies to your system, use pidstat command. It prints activity of every selected task or all tasks managed by Linux kernel if no task is specified. You can also set the number of reports to be displayed and the time interval between them.
For example, pidstat -C top 2 3
prints the load statistic for tasks whose command name includes the
string “top”. There will be three reports printed at two
second intervals.
tux@mercury:~> pidstat -C top 2 3
Linux 2.6.27.19-5-default (geeko@buildhost) 	03/23/2009 	_x86_64_

09:25:42 AM       PID    %usr %system  %guest    %CPU   CPU  Command
09:25:44 AM     23576   37.62   61.39    0.00   99.01     1  top

09:25:44 AM       PID    %usr %system  %guest    %CPU   CPU  Command
09:25:46 AM     23576   37.00   62.00    0.00   99.00     1  top

09:25:46 AM       PID    %usr %system  %guest    %CPU   CPU  Command
09:25:48 AM     23576   38.00   61.00    0.00   99.00     1  top

Average:          PID    %usr %system  %guest    %CPU   CPU  Command
Average:        23576   37.54   61.46    0.00   99.00     -  top
2.2.4. Kernel Ring Buffer: dmesg
The Linux kernel keeps certain messages in a ring buffer. To view these messages, enter the command dmesg:
tux@mercury:~> dmesg
[...]
end_request: I/O error, dev fd0, sector 0
subfs: unsuccessful attempt to mount media (256)
e100: eth0: e100_watchdog: link up, 100Mbps, half-duplex
NET: Registered protocol family 17
IA-32 Microcode Update Driver: v1.14 <tigran@veritas.com>
microcode: CPU0 updated from revision 0xe to 0x2e, date = 08112004
IA-32 Microcode Update Driver v1.14 unregistered
bootsplash: status on console 0 changed to on
NET: Registered protocol family 10
Disabled Privacy Extensions on device c0326ea0(lo)
IPv6 over IPv4 tunneling driver
powernow: This module only works with AMD K7 CPUs
bootsplash: status on console 0 changed to on
Older events are logged in the files
/var/log/messages and
/var/log/warn.
2.2.5. List of Open Files: lsof
To view a list of all the files open for the process with process ID
PID, use -p. For example, to
view all the files used by the current shell, enter:
tux@mercury:~> lsof -p $$
COMMAND  PID   USER   FD   TYPE DEVICE  SIZE/OFF NODE NAME
bash    5552 tux  cwd    DIR    3,3    1512 117619 /home/tux
bash    5552 tux  rtd    DIR    3,3     584      2 /
bash    5552 tux  txt    REG    3,3  498816  13047 /bin/bash
bash    5552 tux  mem    REG    0,0              0 [heap] (stat: No such
bash    5552 tux  mem    REG    3,3  217016 115687 /var/run/nscd/passwd
bash    5552 tux  mem    REG    3,3  208464  11867 /usr/lib/locale/en_GB.
[...]
bash    5552 tux  mem    REG    3,3     366   9720 /usr/lib/locale/en_GB.
bash    5552 tux  mem    REG    3,3   97165   8828 /lib/ld-2.3.6.so
bash    5552 tux    0u   CHR  136,5              7 /dev/pts/5
bash    5552 tux    1u   CHR  136,5              7 /dev/pts/5
bash    5552 tux    2u   CHR  136,5              7 /dev/pts/5
bash    5552 tux  255u   CHR  136,5              7 /dev/pts/5
The special shell variable $$, whose value is the
process ID of the shell, has been used.
The command lsof lists all the files currently open when used without any parameters. There are often thousands of open files, therefore, listing all of them is rarely useful. However, the list of all files can be combined with search functions to generate useful lists. For example, list all used character devices:
tux@mercury:~> lsof | grep CHR
bash      3838     tux    0u      CHR  136,0                 2 /dev/pts/0
bash      3838     tux    1u      CHR  136,0                 2 /dev/pts/0
bash      3838     tux    2u      CHR  136,0                 2 /dev/pts/0
bash      3838     tux  255u      CHR  136,0                 2 /dev/pts/0
bash      5552     tux    0u      CHR  136,5                 7 /dev/pts/5
bash      5552     tux    1u      CHR  136,5                 7 /dev/pts/5
bash      5552     tux    2u      CHR  136,5                 7 /dev/pts/5
bash      5552     tux  255u      CHR  136,5                 7 /dev/pts/5
X         5646       root  mem       CHR    1,1              1006 /dev/mem
lsof      5673     tux    0u      CHR  136,5                 7 /dev/pts/5
lsof      5673     tux    2u      CHR  136,5                 7 /dev/pts/5
grep      5674     tux    1u      CHR  136,5                 7 /dev/pts/5
grep      5674     tux    2u      CHR  136,5                 7 /dev/pts/5
When used with -i, lsof lists
currently open Internet files as well:
tux@mercury:~> lsof -i
[...]
pidgin     4349 tux   17r  IPv4  15194      0t0  TCP \
 jupiter.example.com:58542->www.example.net:https (ESTABLISHED)
pidgin     4349 tux   21u  IPv4  15583      0t0  TCP \
 jupiter.example.com:37051->aol.example.org:aol (ESTABLISHED)
evolution  4578 tux   38u  IPv4  16102      0t0  TCP \
 jupiter.example.com:57419->imap.example.com:imaps (ESTABLISHED)
npviewer.  9425 tux   40u  IPv4  24769      0t0  TCP \
 jupiter.example.com:51416->www.example.com:http (CLOSE_WAIT)
npviewer.  9425 tux   49u  IPv4  24814      0t0  TCP \
 jupiter.example.com:43964->www.example.org:http (CLOSE_WAIT)
ssh       17394 tux    3u  IPv4  40654      0t0  TCP \
 jupiter.example.com:35454->saturn.example.com:ssh (ESTABLISHED)
2.2.6. Kernel and udev Event Sequence Viewer: udevadm monitor
udevadm monitor listens to the kernel uevents and events sent out by a udev rule and prints the device path (DEVPATH) of the event to the console. This is a sequence of events while connecting a USB memory stick:
| Monitoring udev Events |
|---|---|
Only root user is allowed to monitor udev events by running the udevadm command. | |
UEVENT[1138806687] add@/devices/pci0000:00/0000:00:1d.7/usb4/4-2/4-2.2
UEVENT[1138806687] add@/devices/pci0000:00/0000:00:1d.7/usb4/4-2/4-2.2/4-2.2
UEVENT[1138806687] add@/class/scsi_host/host4
UEVENT[1138806687] add@/class/usb_device/usbdev4.10
UDEV  [1138806687] add@/devices/pci0000:00/0000:00:1d.7/usb4/4-2/4-2.2
UDEV  [1138806687] add@/devices/pci0000:00/0000:00:1d.7/usb4/4-2/4-2.2/4-2.2
UDEV  [1138806687] add@/class/scsi_host/host4
UDEV  [1138806687] add@/class/usb_device/usbdev4.10
UEVENT[1138806692] add@/devices/pci0000:00/0000:00:1d.7/usb4/4-2/4-2.2/4-2.2
UEVENT[1138806692] add@/block/sdb
UEVENT[1138806692] add@/class/scsi_generic/sg1
UEVENT[1138806692] add@/class/scsi_device/4:0:0:0
UDEV  [1138806693] add@/devices/pci0000:00/0000:00:1d.7/usb4/4-2/4-2.2/4-2.2
UDEV  [1138806693] add@/class/scsi_generic/sg1
UDEV  [1138806693] add@/class/scsi_device/4:0:0:0
UDEV  [1138806693] add@/block/sdb
UEVENT[1138806694] add@/block/sdb/sdb1
UDEV  [1138806694] add@/block/sdb/sdb1
UEVENT[1138806694] mount@/block/sdb/sdb1
UEVENT[1138806697] umount@/block/sdb/sdb1
2.2.7. Information on Security Events: audit
The Linux audit framework is a complex auditing system that collects detailed information about all security related events. These records can be consequently analyzed to discover if, for example, a violation of security policies occurred.
2.2.8. Server Resources Used by X11 Clients: xrestop
xrestop provides statistics for each connected X11 client's server-side resource. The output is very similar to Section 2.3.4, “Table of Processes: top”.
xrestop - Display: localhost:0
          Monitoring 40 clients. XErrors: 0
          Pixmaps:   42013K total, Other:     206K total, All:   42219K total

res-base Wins  GCs Fnts Pxms Misc   Pxm mem  Other   Total   PID Identifier
3e00000   385   36    1  751  107    18161K     13K  18175K   ?   NOVELL: SU
4600000   391  122    1 1182  889     4566K     33K   4600K   ?   amaroK - S
1600000    35   11    0   76  142     3811K      4K   3816K   ?   KDE Deskto
3400000    52   31    1   69   74     2816K      4K   2820K   ?   Linux Shel
2c00000    50   25    1   43   50     2374K      3K   2378K   ?   Linux Shel
2e00000    50   10    1   36   42     2341K      3K   2344K   ?   Linux Shel
2600000    37   24    1   34   50     1772K      3K   1775K   ?   Root - Kon
4800000    37   24    1   34   49     1772K      3K   1775K   ?   Root - Kon
2a00000   209   33    1  323  238     1111K     12K   1123K   ?   Trekstor25
1800000   182   32    1  302  285     1039K     12K   1052K   ?   kicker
1400000   157  121    1  231  477      777K     18K    796K   ?   kwin
3c00000   175   36    1  248  168      510K      9K    520K   ?   de.comp.la
3a00000   326   42    1  579  444      486K     20K    506K   ?   [opensuse-
0a00000    85   38    1  317  224      102K      9K    111K   ?   Kopete
4e00000    25   17    1   60   66       63K      3K     66K   ?   YaST Contr
2400000    11   10    0   56   51       53K      1K     55K 22061 suseplugge
0e00000    20   12    1   50   92       50K      3K     54K 22016 kded
3200000     6   41    5   72   84       40K      8K     48K   ?   EMACS
2200000    54    9    1   30   31       42K      3K     45K   ?   SUSEWatche
4400000     2   11    1   30   34       34K      2K     36K 16489 kdesu
1a00000   255    7    0   42   11       19K      6K     26K   ?   KMix
3800000     2   14    1   34   37       21K      2K     24K 22242 knotify
1e00000    10    7    0   42    9       15K    624B     15K   ?   KPowersave
3600000   106    6    1   30    9        7K      3K     11K 22236 konqueror
2000000    10    5    0   21   34        9K      1K     10K   ?   klipper
3000000    21    7    0   11    9        7K    888B      8K   ?   KDE Wallet
2.3. Processes
2.3.1. Interprocess Communication: ipcs
The command ipcs produces a list of the IPC resources currently in use:
------ Shared Memory Segments --------
key        shmid      owner     perms      bytes      nattch     status
0x00000000 58261504   tux    600        393216     2          dest
0x00000000 58294273   tux    600        196608     2          dest
0x00000000 83886083   tux    666        43264      2
0x00000000 83951622   tux    666        192000     2
0x00000000 83984391   tux    666        282464     2
0x00000000 84738056   root      644        151552     2          dest

------ Semaphore Arrays --------
key        semid      owner     perms      nsems
0x4d038abf 0          tux    600        8

------ Message Queues --------
key        msqid      owner      perms      used-bytes   messages
2.3.2. Process List: ps
The command ps produces a list of processes. Most parameters must be written without a minus sign. Refer to ps --help for a brief help or to the man page for extensive help.
To list all processes with user and command line information, use ps axu:
tux@mercury:~> ps axu
USER       PID %CPU %MEM    VSZ   RSS TTY      STAT START   TIME COMMAND
root         1  0.0  0.0    696   272 ?        S    12:59   0:01 init [5]
root         2  0.0  0.0      0     0 ?        SN   12:59   0:00 [ksoftirqd
root         3  0.0  0.0      0     0 ?        S<   12:59   0:00 [events
[...]
tux    4047  0.0  6.0 158548 31400 ?        Ssl  13:02   0:06 mono-best
tux    4057  0.0  0.7   9036  3684 ?        Sl   13:02   0:00 /opt/gnome
tux    4067  0.0  0.1   2204   636 ?        S    13:02   0:00 /opt/gnome
tux    4072  0.0  1.0  15996  5160 ?        Ss   13:02   0:00 gnome-scre
tux    4114  0.0  3.7 130988 19172 ?        SLl  13:06   0:04 sound-juic
tux    4818  0.0  0.3   4192  1812 pts/0    Ss   15:59   0:00 -bash
tux    4959  0.0  0.1   2324   816 pts/0    R+   16:17   0:00 ps axu
To check how many sshd processes are running, use the
option -p together with the command
pidof, which lists the process IDs of the given
processes.
tux@mercury:~> ps -p $(pidof sshd)
  PID TTY      STAT   TIME COMMAND
 3524 ?        Ss     0:00 /usr/sbin/sshd -o PidFile=/var/run/sshd.init.pid
 4813 ?        Ss     0:00 sshd: tux [priv]
 4817 ?        R      0:00 sshd: tux@pts/0
The process list can be formatted according to your needs. The option
-L returns a list of all keywords. Enter the following
command to issue a list of all processes sorted by memory usage:
tux@mercury:~> ps ax --format pid,rss,cmd --sort rss
  PID   RSS CMD
    2     0 [ksoftirqd/0]
    3     0 [events/0]
    4     0 [khelper]
    5     0 [kthread]
   11     0 [kblockd/0]
   12     0 [kacpid]
  472     0 [pdflush]
  473     0 [pdflush]
[...]
 4028 17556 nautilus --no-default-window --sm-client-id default2
 4118 17800 ksnapshot
 4114 19172 sound-juicer
 4023 25144 gnome-panel --sm-client-id default1
 4047 31400 mono-best --debug /usr/lib/beagle/Best.exe --autostarted
 3973 31520 mono-beagled --debug /usr/lib/beagle/BeagleDaemon.exe --bg --aut
Useful ps Calls
- ps aux
--sortcolumn Sort the output by
column. Replacecolumnwithpmemfor physical memory ratiopcpufor CPU ratiorssfor resident set size (non-swapped physical memory)- ps axo pid,%cpu,rss,vsz,args,wchan
Shows every process, their PID, CPU usage ratio, memory size (resident and virtual), name, and their syscall.
- ps axfo pid,args
Show a process tree.
2.3.3. Process Tree: pstree
The command pstree produces a list of processes in the form of a tree:
tux@mercury:~> pstree
init-+-NetworkManagerD
     |-acpid
     |-3*[automount]
     |-cron
     |-cupsd
     |-2*[dbus-daemon]
     |-dbus-launch
     |-dcopserver
     |-dhcpcd
     |-events/0
     |-gpg-agent
     |-hald-+-hald-addon-acpi
     |      `-hald-addon-stor
     |-kded
     |-kdeinit-+-kdesu---su---kdesu_stub---yast2---y2controlcenter
     |         |-kio_file
     |         |-klauncher
     |         |-konqueror
     |         |-konsole-+-bash---su---bash
     |         |         `-bash
     |         `-kwin
     |-kdesktop---kdesktop_lock---xmatrix
     |-kdesud
     |-kdm-+-X
     |     `-kdm---startkde---kwrapper
[...]
The parameter -p adds the process ID to a given name.
To have the command lines displayed as well, use the -a
parameter:
2.3.4. Table of Processes: top
The command top, which stands for table of
processes, displays a list of processes that is refreshed
every two seconds. To terminate the program, press Q.
The parameter -n 1 terminates the program after a
single display of the process list. The following is an example output
of the command top -n 1:
tux@mercury:~> top -n 1
top - 17:06:28 up  2:10,  5 users,  load average: 0.00, 0.00, 0.00
Tasks:  85 total,   1 running,  83 sleeping,   1 stopped,   0 zombie
Cpu(s):  5.5% us,  0.8% sy,  0.8% ni, 91.9% id,  1.0% wa,  0.0% hi,  0.0% si
Mem:    515584k total,   506468k used,     9116k free,    66324k buffers
Swap:   658656k total,        0k used,   658656k free,   353328k cached

  PID USER      PR  NI  VIRT  RES  SHR S %CPU %MEM    TIME+  COMMAND
    1 root      16   0   700  272  236 S  0.0  0.1   0:01.33 init
    2 root      34  19     0    0    0 S  0.0  0.0   0:00.00 ksoftirqd/0
    3 root      10  -5     0    0    0 S  0.0  0.0   0:00.27 events/0
    4 root      10  -5     0    0    0 S  0.0  0.0   0:00.01 khelper
    5 root      10  -5     0    0    0 S  0.0  0.0   0:00.00 kthread
   11 root      10  -5     0    0    0 S  0.0  0.0   0:00.05 kblockd/0
   12 root      20  -5     0    0    0 S  0.0  0.0   0:00.00 kacpid
  472 root      20   0     0    0    0 S  0.0  0.0   0:00.00 pdflush
  473 root      15   0     0    0    0 S  0.0  0.0   0:00.06 pdflush
  475 root      11  -5     0    0    0 S  0.0  0.0   0:00.00 aio/0
  474 root      15   0     0    0    0 S  0.0  0.0   0:00.07 kswapd0
  681 root      10  -5     0    0    0 S  0.0  0.0   0:00.01 kseriod
  839 root      10  -5     0    0    0 S  0.0  0.0   0:00.02 reiserfs/0
  923 root      13  -4  1712  552  344 S  0.0  0.1   0:00.67 udevd
 1343 root      10  -5     0    0    0 S  0.0  0.0   0:00.00 khubd
 1587 root      20   0     0    0    0 S  0.0  0.0   0:00.00 shpchpd_event
 1746 root      15   0     0    0    0 S  0.0  0.0   0:00.00 w1_control
 1752 root      15   0     0    0    0 S  0.0  0.0   0:00.00 w1_bus_master1
 2151 root      16   0  1464  496  416 S  0.0  0.1   0:00.00 acpid
 2165 messageb  16   0  3340 1048  792 S  0.0  0.2   0:00.64 dbus-daemon
 2166 root      15   0  1840  752  556 S  0.0  0.1   0:00.01 syslog-ng
 2171 root      16   0  1600  516  320 S  0.0  0.1   0:00.00 klogd
 2235 root      15   0  1736  800  652 S  0.0  0.2   0:00.10 resmgrd
 2289 root      16   0  4192 2852 1444 S  0.0  0.6   0:02.05 hald
 2403 root      23   0  1756  600  524 S  0.0  0.1   0:00.00 hald-addon-acpi
 2709 root      19   0  2668 1076  944 S  0.0  0.2   0:00.00 NetworkManagerD
 2714 root      16   0  1756  648  564 S  0.0  0.1   0:00.56 hald-addon-stor
By default the output is sorted by CPU usage (column , shortcut +P). Use following shortcuts to change the sort field:
| +M: Resident Memory () |
| +N: Process ID () |
| +T: Time () |
To use any other field for sorting, press F and select a field from the list. To toggle the sort order, Use +R.
The parameter -U
monitors only the processes associated with a particular user. Replace
UIDUID with the user ID of the user. Use
top -U $(id -u) to show processes of the current user
2.3.5. Modify a process' niceness: nice and renice
The kernel determines which processes require more CPU time than others
by the process' nice level, also called niceness. The higher the
“nice” level of a process is, the less CPU time it will
take from other processes. Nice levels range from -20 (the least
“nice” level) to 19. Negative values can only be set by
root.
Adjusting the niceness level is useful when running a non time-critical process that lasts long and uses large amounts of CPU time, such as compiling a kernel on a system that also performs other tasks. Making such a process “nicer”, ensures that the other tasks, for example a Web server, will have a higher priority.
Calling nice without any parameters prints the current niceness:
tux@mercury:~> nice
0
Running nice command
increments the current nice level for the given command by 10. Using
nice -n
levelcommand lets you specify a new
niceness relative to the current one.
To change the niceness of a running process, use renice
priority -p , for example:
process
id
renice +5 3266
To renice all processes owned by a specific user, use the option
-u . Process groups are
reniced by the option user-g .
process group
id
2.4. Memory
2.4.1. Memory Usage: free
The utility free examines RAM and swap usage. Details of both free and used memory and swap areas are shown:
tux@mercury:~> free
            total       used       free     shared    buffers     cached
Mem:       2062844    2047444      15400          0     129580     921936
-/+ buffers/cache:     995928    1066916
Swap:      2104472          0    2104472
The options -b, -k,
-m, -g show the output in bytes, KB,
MB, or GB, respectively. The parameter -d delay ensures
that the display is refreshed every delay
seconds. For example, free -d 1.5 produces an update
every 1.5 seconds.
2.4.2. Detailed Memory Usage: /proc/meminfo
Use /proc/meminfo to get more detailed information
on memory usage than with free. Actually
free uses some of the data from this file. See an
example output from a 64bit system below. Note that it slightly differs
on 32bit systems due to different memory management):
tux@mercury:~> cat /proc/meminfo
MemTotal:        8182956 kB
MemFree:         1045744 kB
Buffers:          364364 kB
Cached:          5601388 kB
SwapCached:         1936 kB
Active:          4048268 kB
Inactive:        2674796 kB
Active(anon):     663088 kB
Inactive(anon):   107108 kB
Active(file):    3385180 kB
Inactive(file):  2567688 kB
Unevictable:           4 kB
Mlocked:               4 kB
SwapTotal:       2096440 kB
SwapFree:        2076692 kB
Dirty:                44 kB
Writeback:             0 kB
AnonPages:        756108 kB
Mapped:           147320 kB
Slab:             329216 kB
SReclaimable:     300220 kB
SUnreclaim:        28996 kB
PageTables:        21092 kB
NFS_Unstable:          0 kB
Bounce:                0 kB
WritebackTmp:          0 kB
CommitLimit:     6187916 kB
Committed_AS:    1388160 kB
VmallocTotal:   34359738367 kB
VmallocUsed:      133384 kB
VmallocChunk:   34359570939 kB
HugePages_Total:       0
HugePages_Free:        0
HugePages_Rsvd:        0
HugePages_Surp:        0
Hugepagesize:       2048 kB
DirectMap4k:     2689024 kB
DirectMap2M:     5691392 kB
The most important entries are:
Total amount of usable RAM
Total amount of unused RAM
File buffer cache in RAM
Page cache (excluding buffer cache) in RAM
Page cache in swap
Recently used memory that normally is not reclaimed. This value is the sum of memory claimed by anonymous pages (listed as ) and file-backed pages (listed as )
Recently unused memory that can be reclaimed. This value is the sum of memory claimed by anonymous pages (listed as ) and file-backed pages (listed as ).
Total amount of swap space
Total amount of unused swap space
Amount of memory that will be written to disk
Amount of memory that currently is written to disk
Memory claimed with the nmap command
Kernel data structure cache
Reclaimable slab caches (inode, dentry, etc.)
An approximation of the total amount of memory (RAM plus swap) the current workload needs in the worst case.
2.4.3. Process Memory Usage: smaps
Exactly determining how much memory a certain process is consuming is
not possible with standard tools like top or
ps. Use the smaps subsystem, introduced in Kernel
2.6.14, if you need exact data. It can be found at
/proc/ and
shows you the number of clean and dirty memory pages the process with
the ID pid/smapsPID is using at that time. It
differentiates between shared and private memory, so you are able to see
how much memory the process is using without including memory shared
with other processes.
2.5. Networking
2.5.1. Show the Network Status: netstat
netstat shows network connections, routing tables
(-r), interfaces (-i), masquerade
connections (-M), multicast memberships
(-g), and statistics (-s).
tux@mercury:~> netstat -r
Kernel IP routing table
Destination     Gateway         Genmask        Flags  MSS Window  irtt Iface
192.168.2.0     *               255.255.254.0  U        0 0          0 eth0
link-local      *               255.255.0.0    U        0 0          0 eth0
loopback        *               255.0.0.0      U        0 0          0 lo
default         192.168.2.254   0.0.0.0        UG       0 0          0 eth0
tux@mercury:~> netstat -i
Kernel Interface table
Iface   MTU Met   RX-OK RX-ERR RX-DRP RX-OVR  TX-OK TX-ERR TX-DRP TX-OVR Flg
eth0   1500   0 1624507 129056      0      0   7055      0      0      0 BMNRU
lo    16436   0   23728      0      0      0  23728      0      0      0 LRU
When displaying network connections or statistics, you can specify the
socket type to display: TCP (-t), UDP
(-u), or raw (-r). The
-p option shows the PID and name of the program to
which each socket belongs.
The following example lists all TCP connections and the programs using these connections.
mercury:~ # netstat -t -p
Active Internet connections (w/o servers)
Proto Recv-Q Send-Q Local Address  Foreign Address       State       PID/Pro
[...]
tcp      0      0 mercury:33513    www.novell.com:www-http ESTABLISHED 6862/fi
tcp      0    352 mercury:ssh      mercury2.:trc-netpoll     ESTABLISHED 19422/s
tcp      0      0 localhost:ssh  localhost:17828         ESTABLISHED -
In the following, statistics for the TCP protocol are displayed:
tux@mercury:~> netstat -s -t
Tcp:
2427 active connections openings
2374 passive connection openings
0 failed connection attempts
0 connection resets received
1 connections established
27476 segments received
26786 segments send out
54 segments retransmited
0 bad segments received.
6 resets sent
[...]
TCPAbortOnLinger: 0
TCPAbortFailed: 0
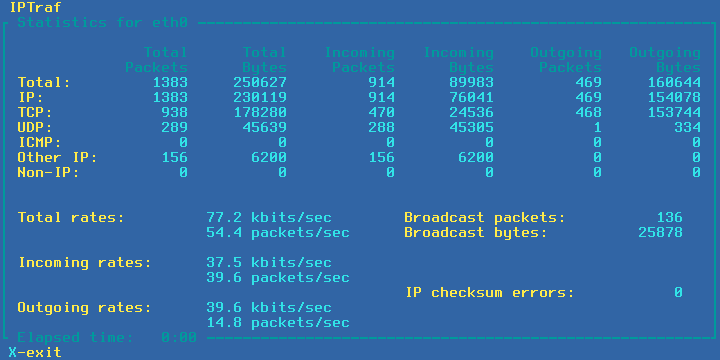
TCPMemoryPressures: 02.5.2. Interactive Network Monitor: iptraf
The iptraf utility is a menu based Local Area Network (LAN) monitor. It generates network statistics, including TCP and UDP counts, Ethernet load information, IP checksum errors and others.
If you enter the command without any option, it runs in an interactive mode. You can navigate through graphical menus and choose the statistics that you want iptraf to report. You can also specify which network interface to examine.
The command iptraf understands several options and
can be run in a batch mode as well. The following example will collect
statistics for network interface eth0 (-i) for 1 minute
(-t). It will be run in the background
(-B) and the statistics will be written to the
iptraf.log file in your home directory
(-L).
tux@mercury:~> iptraf -i eth0 -t 1 -B -L ~/iptraf.log
You can examine the log file with the more command:
tux@mercury:~> more ~/iptraf.log
Mon Mar 23 10:08:02 2010; ******** IP traffic monitor started ********
Mon Mar 23 10:08:02 2010; UDP; eth0; 107 bytes; from 192.168.1.192:33157 to \
 239.255.255.253:427
Mon Mar 23 10:08:02 2010; VRRP; eth0; 46 bytes; from 192.168.1.252 to \
 224.0.0.18
Mon Mar 23 10:08:03 2010; VRRP; eth0; 46 bytes; from 192.168.1.252 to \
 224.0.0.18
Mon Mar 23 10:08:03 2010; VRRP; eth0; 46 bytes; from 192.168.1.252 to \
 224.0.0.18
[...]
Mon Mar 23 10:08:06 2010; UDP; eth0; 132 bytes; from 192.168.1.54:54395 to \
 10.20.7.255:111
Mon Mar 23 10:08:06 2010; UDP; eth0; 46 bytes; from 192.168.1.92:27258 to \
 10.20.7.255:8765
Mon Mar 23 10:08:06 2010; UDP; eth0; 124 bytes; from 192.168.1.139:43464 to \
 10.20.7.255:111
Mon Mar 23 10:08:06 2010; VRRP; eth0; 46 bytes; from 192.168.1.252 to \
 224.0.0.18
--More--(7%)
2.6. The /proc File System
The /proc file system is a pseudo file system in
which the kernel reserves important information in the form of virtual
files. For example, display the CPU type with this command:
tux@mercury:~> cat /proc/cpuinfo
processor       : 0
vendor_id       : GenuineIntel
cpu family      : 15
model           : 4
model name      : Intel(R) Pentium(R) 4 CPU 3.40GHz
stepping        : 3
cpu MHz         : 2800.000
cache size      : 2048 KB
physical id     : 0
[...]
Query the allocation and use of interrupts with the following command:
tux@mercury:~> cat /proc/interrupts
           CPU0
  0:    3577519          XT-PIC  timer
  1:        130          XT-PIC  i8042
  2:          0          XT-PIC  cascade
  5:     564535          XT-PIC  Intel 82801DB-ICH4
  7:          1          XT-PIC  parport0
  8:          2          XT-PIC  rtc
  9:          1          XT-PIC  acpi, uhci_hcd:usb1, ehci_hcd:usb4
 10:          0          XT-PIC  uhci_hcd:usb3
 11:      71772          XT-PIC  uhci_hcd:usb2, eth0
 12:     101150          XT-PIC  i8042
 14:      33146          XT-PIC  ide0
 15:     149202          XT-PIC  ide1
NMI:          0
LOC:          0
ERR:          0
MIS:          0
Some of the important files and their contents are:
/proc/devicesAvailable devices
/proc/modulesKernel modules loaded
/proc/cmdlineKernel command line
/proc/meminfoDetailed information about memory usage
/proc/config.gzgzip-compressed configuration file of the kernel currently running
Further information is available in the text file
/usr/src/linux/Documentation/filesystems/proc.txt
(this file is available when the package
kernel-source is installed). Find information
about processes currently running in the
/proc/NNN directories,
where NNN is the process ID (PID) of the
relevant process. Every process can find its own characteristics in
/proc/self/:
tux@mercury:~> ls -l /proc/self
lrwxrwxrwx 1 root root 64 2007-07-16 13:03 /proc/self -> 5356
tux@mercury:~> ls -l /proc/self/
total 0
dr-xr-xr-x 2 tux users 0 2007-07-16 17:04 attr
-r-------- 1 tux users 0 2007-07-16 17:04 auxv
-r--r--r-- 1 tux users 0 2007-07-16 17:04 cmdline
lrwxrwxrwx 1 tux users 0 2007-07-16 17:04 cwd -> /home/tux
-r-------- 1 tux users 0 2007-07-16 17:04 environ
lrwxrwxrwx 1 tux users 0 2007-07-16 17:04 exe -> /bin/ls
dr-x------ 2 tux users 0 2007-07-16 17:04 fd
-rw-r--r-- 1 tux users 0 2007-07-16 17:04 loginuid
-r--r--r-- 1 tux users 0 2007-07-16 17:04 maps
-rw------- 1 tux users 0 2007-07-16 17:04 mem
-r--r--r-- 1 tux users 0 2007-07-16 17:04 mounts
-rw-r--r-- 1 tux users 0 2007-07-16 17:04 oom_adj
-r--r--r-- 1 tux users 0 2007-07-16 17:04 oom_score
lrwxrwxrwx 1 tux users 0 2007-07-16 17:04 root -> /
-rw------- 1 tux users 0 2007-07-16 17:04 seccomp
-r--r--r-- 1 tux users 0 2007-07-16 17:04 smaps
-r--r--r-- 1 tux users 0 2007-07-16 17:04 stat
[...]
dr-xr-xr-x 3 tux users 0 2007-07-16 17:04 task
-r--r--r-- 1 tux users 0 2007-07-16 17:04 wchan
The address assignment of executables and libraries is contained in the
maps file:
tux@mercury:~> cat /proc/self/maps
08048000-0804c000 r-xp 00000000 03:03 17753      /bin/cat
0804c000-0804d000 rw-p 00004000 03:03 17753      /bin/cat
0804d000-0806e000 rw-p 0804d000 00:00 0          [heap]
b7d27000-b7d5a000 r--p 00000000 03:03 11867      /usr/lib/locale/en_GB.utf8/
b7d5a000-b7e32000 r--p 00000000 03:03 11868      /usr/lib/locale/en_GB.utf8/
b7e32000-b7e33000 rw-p b7e32000 00:00 0
b7e33000-b7f45000 r-xp 00000000 03:03 8837       /lib/libc-2.3.6.so
b7f45000-b7f46000 r--p 00112000 03:03 8837       /lib/libc-2.3.6.so
b7f46000-b7f48000 rw-p 00113000 03:03 8837       /lib/libc-2.3.6.so
b7f48000-b7f4c000 rw-p b7f48000 00:00 0
b7f52000-b7f53000 r--p 00000000 03:03 11842      /usr/lib/locale/en_GB.utf8/
[...]
b7f5b000-b7f61000 r--s 00000000 03:03 9109       /usr/lib/gconv/gconv-module
b7f61000-b7f62000 r--p 00000000 03:03 9720       /usr/lib/locale/en_GB.utf8/
b7f62000-b7f76000 r-xp 00000000 03:03 8828       /lib/ld-2.3.6.so
b7f76000-b7f78000 rw-p 00013000 03:03 8828       /lib/ld-2.3.6.so
bfd61000-bfd76000 rw-p bfd61000 00:00 0          [stack]
ffffe000-fffff000 ---p 00000000 00:00 0          [vdso]
2.6.1. procinfo
Important information from the /proc file system is
summarized by the command procinfo:
tux@mercury:~> procinfo
Linux 2.6.32.7-0.2-default (geeko@buildhost) (gcc 4.3.4) #1 2CPU

Memory:      Total        Used        Free      Shared     Buffers
Mem:       2060604     2011264       49340           0      200664
Swap:      2104472         112     2104360

Bootup: Wed Feb 17 03:39:33 2010    Load average: 0.86 1.10 1.11 3/118 21547

user  :       2:43:13.78   0.8%  page in :   71099181  disk 1:  2827023r 968
nice  :   1d 22:21:27.87  14.7%  page out:  690734737
system:      13:39:57.57   4.3%  page act:  138388345
IOwait:      18:02:18.59   5.7%  page dea:   29639529
hw irq:       0:03:39.44   0.0%  page flt: 9539791626
sw irq:       1:15:35.25   0.4%  swap in :         69
idle  :   9d 16:07:56.79  73.8%  swap out:        209
uptime:   6d 13:07:11.14         context :  542720687

irq  0: 141399308 timer          irq 14:   5074312 ide0
irq  1:     73784 i8042          irq 50:   1938076 uhci_hcd:usb1, ehci_
irq  4:         2                irq 58:         0 uhci_hcd:usb2
irq  6:         5 floppy [2]     irq 66:    872711 uhci_hcd:usb3, HDA I
irq  7:         2                irq 74:        15 uhci_hcd:usb4
irq  8:         0 rtc            irq 82: 178717720 0         PCI-MSI  e
irq  9:         0 acpi           irq169:  44352794 nvidia
irq 12:         3                irq233:   8209068 0         PCI-MSI  l
To see all the information, use the parameter -a. The
parameter -nN produces updates of the information every
N seconds. In this case, terminate the
program by pressing q.
By default, the cumulative values are displayed. The parameter
-d produces the differential values. procinfo
-dn5 displays the values that have changed in the last five
seconds:
2.7. Hardware Information
2.7.1. PCI Resources: lspci
| Accessing PCI configuration. |
|---|---|
Most operating systems require root user privileges to grant access to the computer's PCI configuration. | |
The command lspci lists the PCI resources:
mercury:~ # lspci
00:00.0 Host bridge: Intel Corporation 82845G/GL[Brookdale-G]/GE/PE \
    DRAM Controller/Host-Hub Interface (rev 01)
00:01.0 PCI bridge: Intel Corporation 82845G/GL[Brookdale-G]/GE/PE \
    Host-to-AGP Bridge (rev 01)
00:1d.0 USB Controller: Intel Corporation 82801DB/DBL/DBM \
    (ICH4/ICH4-L/ICH4-M) USB UHCI Controller #1 (rev 01)
00:1d.1 USB Controller: Intel Corporation 82801DB/DBL/DBM \
    (ICH4/ICH4-L/ICH4-M) USB UHCI Controller #2 (rev 01)
00:1d.2 USB Controller: Intel Corporation 82801DB/DBL/DBM \
    (ICH4/ICH4-L/ICH4-M) USB UHCI Controller #3 (rev 01)
00:1d.7 USB Controller: Intel Corporation 82801DB/DBM \
    (ICH4/ICH4-M) USB2 EHCI Controller (rev 01)
00:1e.0 PCI bridge: Intel Corporation 82801 PCI Bridge (rev 81)
00:1f.0 ISA bridge: Intel Corporation 82801DB/DBL (ICH4/ICH4-L) \
    LPC Interface Bridge (rev 01)
00:1f.1 IDE interface: Intel Corporation 82801DB (ICH4) IDE \
    Controller (rev 01)
00:1f.3 SMBus: Intel Corporation 82801DB/DBL/DBM (ICH4/ICH4-L/ICH4-M) \
    SMBus Controller (rev 01)
00:1f.5 Multimedia audio controller: Intel Corporation 82801DB/DBL/DBM \
    (ICH4/ICH4-L/ICH4-M) AC'97 Audio Controller (rev 01)
01:00.0 VGA compatible controller: Matrox Graphics, Inc. G400/G450 (rev 85)
02:08.0 Ethernet controller: Intel Corporation 82801DB PRO/100 VE (LOM) \
    Ethernet Controller (rev 81)
Using -v results in a more detailed listing:
mercury:~ # lspci -v
[...]
00:03.0 Ethernet controller: Intel Corporation 82540EM Gigabit Ethernet \
Controller (rev 02)
  Subsystem: Intel Corporation PRO/1000 MT Desktop Adapter
  Flags: bus master, 66MHz, medium devsel, latency 64, IRQ 19
  Memory at f0000000 (32-bit, non-prefetchable) [size=128K]
  I/O ports at d010 [size=8]
  Capabilities: [dc] Power Management version 2
  Capabilities: [e4] PCI-X non-bridge device
  Kernel driver in use: e1000
  Kernel modules: e1000
Information about device name resolution is obtained from the file
/usr/share/pci.ids. PCI IDs not listed in this file
are marked “Unknown device.”
The parameter -vv produces all the information that
could be queried by the program. To view the pure numeric values, use
the parameter -n.
2.7.2. USB Devices: lsusb
The command lsusb lists all USB devices. With the
option -v, print a more detailed list. The detailed
information is read from the directory
/proc/bus/usb/. The following is the output of
lsusb with these USB devices attached: hub, memory
stick, hard disk and mouse.
mercury:/ # lsusb
Bus 004 Device 007: ID 0ea0:2168 Ours Technology, Inc. Transcend JetFlash \
    2.0 / Astone USB Drive
Bus 004 Device 006: ID 04b4:6830 Cypress Semiconductor Corp. USB-2.0 IDE \
    Adapter
Bus 004 Device 005: ID 05e3:0605 Genesys Logic, Inc.
Bus 004 Device 001: ID 0000:0000
Bus 003 Device 001: ID 0000:0000
Bus 002 Device 001: ID 0000:0000
Bus 001 Device 005: ID 046d:c012 Logitech, Inc. Optical Mouse
Bus 001 Device 001: ID 0000:0000
2.8. Files and File Systems
2.8.1. Determine the File Type: file
The command file determines the type of a file or a
list of files by checking /usr/share/misc/magic.
tux@mercury:~> file /usr/bin/file
/usr/bin/file: ELF 64-bit LSB executable, x86-64, version 1 (SYSV), \
    for GNU/Linux 2.6.4, dynamically linked (uses shared libs), stripped
The parameter -f
specifies a file with a list of filenames to examine. The
list-z allows file to look inside
compressed files:
tux@mercury:~> file /usr/share/man/man1/file.1.gz
/usr/share/man/man1/file.1.gz: gzip compressed data, from Unix, max compression
tux@mercury:~> file -z /usr/share/man/man1/file.1.gz
/usr/share/man/man1/file.1.gz: troff or preprocessor input text \
    (gzip compressed data, from Unix, max compression)
The parameter -i outputs a mime type string rather than
the traditional description.
tux@mercury:~> file -i /usr/share/misc/magic
/usr/share/misc/magic: text/plain charset=utf-8
2.8.2. File Systems and Their Usage: mount, df and du
The command mount shows which file system (device and type) is mounted at which mount point:
tux@mercury:~> mount
/dev/sda2 on / type ext4 (rw,acl,user_xattr)
proc on /proc type proc (rw)
sysfs on /sys type sysfs (rw)
debugfs on /sys/kernel/debug type debugfs (rw)
devtmpfs on /dev type devtmpfs (rw,mode=0755)
tmpfs on /dev/shm type tmpfs (rw,mode=1777)
devpts on /dev/pts type devpts (rw,mode=0620,gid=5)
/dev/sda3 on /home type ext3 (rw)
securityfs on /sys/kernel/security type securityfs (rw)
fusectl on /sys/fs/fuse/connections type fusectl (rw)
gvfs-fuse-daemon on /home/tux/.gvfs type fuse.gvfs-fuse-daemon \
(rw,nosuid,nodev,user=tux)
Obtain information about total usage of the file systems with the
command df. The parameter -h (or
--human-readable) transforms the output into a form
understandable for common users.
tux@mercury:~> df -h
Filesystem            Size  Used Avail Use% Mounted on
/dev/sda2              20G  5,9G   13G  32% /
devtmpfs              1,6G  236K  1,6G   1% /dev
tmpfs                 1,6G  668K  1,6G   1% /dev/shm
/dev/sda3             208G   40G  159G  20% /home
Display the total size of all the files in a given directory and its
subdirectories with the command du. The parameter
-s suppresses the output of detailed information and
gives only a total for each argument. -h again
transforms the output into a human-readable form:
tux@mercury:~> du -sh /opt
192M    /opt
2.8.3. Additional Information about ELF Binaries
Read the content of binaries with the readelf utility. This even works with ELF files that were built for other hardware architectures:
tux@mercury:~> readelf --file-header /bin/ls
ELF Header:
  Magic:   7f 45 4c 46 02 01 01 00 00 00 00 00 00 00 00 00
  Class:                             ELF64
  Data:                              2's complement, little endian
  Version:                           1 (current)
  OS/ABI:                            UNIX - System V
  ABI Version:                       0
  Type:                              EXEC (Executable file)
  Machine:                           Advanced Micro Devices X86-64
  Version:                           0x1
  Entry point address:               0x402540
  Start of program headers:          64 (bytes into file)
  Start of section headers:          95720 (bytes into file)
  Flags:                             0x0
  Size of this header:               64 (bytes)
  Size of program headers:           56 (bytes)
  Number of program headers:         9
  Size of section headers:           64 (bytes)
  Number of section headers:         32
  Section header string table index: 31
2.8.4. File Properties: stat
The command stat displays file properties:
tux@mercury:~> stat /etc/profile
  File: `/etc/profile'
  Size: 9662      	Blocks: 24         IO Block: 4096   regular file
Device: 802h/2050d	Inode: 132349      Links: 1
Access: (0644/-rw-r--r--)  Uid: (    0/    root)   Gid: (    0/    root)
Access: 2009-03-20 07:51:17.000000000 +0100
Modify: 2009-01-08 19:21:14.000000000 +0100
Change: 2009-03-18 12:55:31.000000000 +0100
The parameter --file-system produces details of the
properties of the file system in which the specified file is located:
tux@mercury:~> stat /etc/profile --file-system
  File: "/etc/profile"
    ID: d4fb76e70b4d1746 Namelen: 255     Type: ext2/ext3
Block size: 4096       Fundamental block size: 4096
Blocks: Total: 2581445    Free: 1717327    Available: 1586197
Inodes: Total: 655776     Free: 490312
2.9. User Information
2.9.1. User Accessing Files: fuser
It can be useful to determine what processes or users are currently
accessing certain files. Suppose, for example, you want to unmount a
file system mounted at /mnt.
umount returns "device is busy." The command
fuser can then be used to determine what processes
are accessing the device:
tux@mercury:~> fuser -v /mnt/*

                     USER        PID ACCESS COMMAND
/mnt/notes.txt       tux    26597 f....  less
Following termination of the less process, which was
running on another terminal, the file system can successfully be
unmounted. When used with -k option,
fuser will kill processes accessing the file as well.
2.9.2. Who Is Doing What: w
With the command w, find out who is logged onto the system and what each user is doing. For example:
tux@mercury:~> w
 14:58:43 up 1 day,  1:21,  2 users,  load average: 0.00, 0.00, 0.00
USER     TTY        LOGIN@   IDLE   JCPU   PCPU WHAT
tux      :0        12:25   ?xdm?   1:23   0.12s /bin/sh /usr/bin/startkde
root     pts/4     14:13    0.00s  0.06s  0.00s w
If any users of other systems have logged in remotely, the parameter
-f shows the computers from which they have established
the connection.
2.10. Time and Date
2.10.1. Time Measurement with time
Determine the time spent by commands with the time utility. This utility is available in two versions: as a shell built-in and as a program (/usr/bin/time).
tux@mercury:~> time find . > /dev/null real 0m4.051suser 0m0.042s
sys 0m0.205s

| The real time that elapsed from the command's start-up till it finished. |
|
CPU time of the user as reported by the |
|
CPU time of the system as reported by the |
2.11. Graph Your Data: RRDtool
There are a lot of data in the world around you, which can be easily measured in time. For example, changes in the temperature, or the number of data sent or received by your computer's network interface. RRDtool can help you store and visualize such data in detailed and customizable graphs.
RRDtool is available for most UNIX platforms and Linux distributions. openSUSE® ships RRDtool as well. Install it either with YaST or by entering
zypper install
rrdtool in the command line as
root.
| |
There are Perl, Python, Ruby, or PHP bindings available for RRDtool, so that you can write your own monitoring scripts with your preferred scripting language. | |
2.11.1. How RRDtool Works
RRDtool is a shortcut of Round Robin Database tool. Round Robin is a method for manipulating with a constant amount of data. It uses the principle of a circular buffer, where there is no end nor beginning to the data row which is being read. RRDtool uses Round Robin Databases to store and read its data.
As mentioned above, RRDtool is designed to work with data that change in time. The ideal case is a sensor which repeatedly reads measured data (like temperature, speed etc.) in constant periods of time, and then exports them in a given format. Such data are perfectly ready for RRDtool, and it is easy to process them and create the desired output.
Sometimes it is not possible to obtain the data automatically and regularly. Their format needs to be pre-processed before it is supplied to RRDtool, and often you need to manipulate RRDtool even manually.
The following is a simple example of basic RRDtool usage. It illustrates all three important phases of the usual RRDtool workflow: creating a database, updating measured values, and viewing the output.
2.11.2. Simple Real Life Example
Suppose we want to collect and view information about the memory usage in the Linux system as it changes in time. To make the example more vivid, we measure the currently free memory for the period of 40 seconds in 4-second intervals. During the measuring, the three hungry applications that usually consume a lot of system memory have been started and closed: the Firefox Web browser, the Evolution e-mail client, and the Eclipse development framework.
2.11.2.1. Collecting Data
RRDtool is very often used to measure and visualize network traffic. In such case, Simple Network Management Protocol (SNMP) is used. This protocol can query network devices for relevant values of their internal counters. Exactly these values are to be stored with RRDtool. For more information on SNMP, see http://www.net-snmp.org/.
Our situation is different - we need to obtain the data manually. A helper script free_mem.sh repetitively reads the current state of free memory and writes it to the standard output.
tux@mercury:~> cat free_mem.sh
INTERVAL=4
for steps in {1..10}
do
    DATE=`date +%s`
    FREEMEM=`free -b | grep "Mem" | awk '{ print $4 }'`
    sleep $INTERVAL
    echo "rrdtool update free_mem.rrd $DATE:$FREEMEM"
done
Points to Notice
The time interval is set to 4 seconds, and is implemented with the sleep command.
RRDtool accepts time information in a special format - so called Unix time. It is defined as the number of seconds since the midnight of January 1, 1970 (UTC). For example, 1272907114 represents 2010-05-03 17:18:34.
The free memory information is reported in bytes with free
-b. Prefer to supply basic units (bytes) instead of multiple units (like kilobytes).The line with the echo ... command contains the future name of the database file (
free_mem.rrd), and together creates a command line for the purpose of updating RRDtool values.
After running free_mem.sh, you see an output similar to this:
tux@mercury:~> sh free_mem.sh
rrdtool update free_mem.rrd 1272974835:1182994432
rrdtool update free_mem.rrd 1272974839:1162817536
rrdtool update free_mem.rrd 1272974843:1096269824
rrdtool update free_mem.rrd 1272974847:1034219520
rrdtool update free_mem.rrd 1272974851:909438976
rrdtool update free_mem.rrd 1272974855:832454656
rrdtool update free_mem.rrd 1272974859:829120512
rrdtool update free_mem.rrd 1272974863:1180377088
rrdtool update free_mem.rrd 1272974867:1179369472
rrdtool update free_mem.rrd 1272974871:1181806592
It is convenient to redirect the command's output to a file with
sh free_mem.sh > free_mem_updates.log
to ease its future execution.
2.11.2.2. Creating Database
Create the initial Robin Round database for our example with the following command:
rrdtool create free_mem.rrd --start 1272974834 --step=4 \
DS:memory:GAUGE:600:U:U RRA:AVERAGE:0.5:1:24
Points to Notice
This command creates a file called
free_mem.rrdfor storing our measured values in a Round Robin type database.The
--startoption specifies the time (in Unix time) when the first value will be added to the database. In this example, it is one less than the first time value of the free_mem.sh output (1272974835).The
--stepspecifies the time interval in seconds with which the measured data will be supplied to the database.The
DS:memory:GAUGE:600:U:Upart introduces a new data source for the database. It is called memory, its type is gauge, the maximum number between two updates is 600 seconds, and the minimal and maximal value in the measured range are unknown (U).RRA:AVERAGE:0.5:1:24creates Round Robin archive (RRA) whose stored data are processed with the consolidation functions (CF) that calculates the average of data points. 3 arguments of the consolidation function are appended to the end of the line .
If no error message is displayed, then
free_mem.rrd database is created in the current
directory:
tux@mercury:~> ls -l free_mem.rrd
-rw-r--r-- 1 tux users 776 May  5 12:50 free_mem.rrd
2.11.2.3. Updating Database Values
After the database is created, you need to fill it with the measured
data. In Section 2.11.2.1, “Collecting Data”, we
already prepared the file free_mem_updates.log
which consists of rrdtool update commands. These
commands do the update of database values for us.
tux@mercury:~> sh free_mem_updates.log; ls -l free_mem.rrd
-rw-r--r--  1 tux users  776 May  5 13:29 free_mem.rrd
As you can see, the size of free_mem.rrd remained
the same even after updating its data.
2.11.2.4. Viewing Measured Values
We have already measured the values, created the database, and stored the measured value in it. Now we can play with the database, and retrieve or view its values.
To retrieve all the values from our database, enter the following on the command line:
tux@mercury:~> rrdtool fetch free_mem.rrd AVERAGE --start 1272974830 \
--end 1272974871
          memory
1272974832: nan
1272974836: 1.1729059840e+09
1272974840: 1.1461806080e+09
1272974844: 1.0807572480e+09
1272974848: 1.0030243840e+09
1272974852: 8.9019289600e+08
1272974856: 8.3162112000e+08
1272974860: 9.1693465600e+08
1272974864: 1.1801251840e+09
1272974868: 1.1799787520e+09
1272974872: nan
Points to Notice
AVERAGEwill fetch average value points from the database, because only one data source is defined (Section 2.11.2.2, “Creating Database”) withAVERAGEprocessing and no other function is available.The first line of the output prints the name of the data source as defined in Section 2.11.2.2, “Creating Database”.
The left results column represents individual points in time, while the right one represents corresponding measured average values in scientific notation.
The
nanin the last line stands for “not a number”.
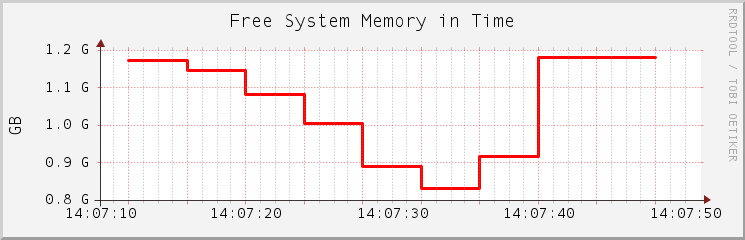
Now a graph representing representing the values stored in the database is drawn:
tux@mercury:~> rrdtool graph free_mem.png \
--start 1272974830 \
--end 1272974871 \
--step=4 \
DEF:free_memory=free_mem.rrd:memory:AVERAGE \
LINE2:free_memory#FF0000 \
--vertical-label "GB" \
--title "Free System Memory in Time" \
--zoom 1.5 \
--x-grid SECOND:1:SECOND:4:SECOND:10:0:%X
Points to Notice
free_mem.pngis the file name of the graph to be created.--startand--endlimit the time range within which the graph will be drawn.--stepspecifies the time resolution (in seconds) of the graph.The
DEF:...part is a data definition called free_memory. Its data are read from thefree_mem.rrddatabase and its data source called memory. The average value points are calculated, because no others were defined in Section 2.11.2.2, “Creating Database”.The
LINE...part specifies properties of the line to be drawn into the graph. It is 2 pixels wide, its data come from the free_memory definition, and its color is red.--vertical-labelsets the label to be printed along the y axis, and--titlesets the main label for the whole graph.--zoomspecifies the zoom factor for the graph. This value must be greater than zero.--x-gridspecifies how to draw grid lines and their labels into the graph. Our example places them every second, while major grid lines are placed every 4 seconds. Labels are placed every 10 seconds under the major grid lines.
2.11.3. For More Information
RRDtool is a very complex tool with a lot of sub-commands and command line options. Some of them are easy to understand, but you have to really study RRDtool to make it produce the results you want and fine-tune them according to your liking.
Apart form RRDtool's man page (man 1 rrdtool) which gives you only basic information, you should have a look at the RRDtool homepage. There is a detailed documentation of the rrdtool command and all its sub-commands. There are also several tutorials to help you understand the common RRDtool workflow.
If you are interested in monitoring network traffic, have a look at MRTG. It stands for Multi Router Traffic Grapher and can graph the activity of all sorts of network devices. It can easily make use of RRDtool.