Chapter 18. Kexec and Kdump
Contents
Kexec is a tool to boot to another kernel from the currently running one. You can perform faster system reboots without any hardware initialization. You can also prepare the system to boot to another kernel if the system crashes.
18.1. Introduction
With Kexec, you can replace the running kernel with another without a hard reboot. The tool is useful for several reasons:
Faster system rebooting
If, for any reasons, you have to reboot the system frequently, Kexec can save you significant time.
Avoiding unreliable firmware and hardware
Nowadays, computer hardware is complex and serious problems may occur during the system start-up. You cannot always replace unreliable hardware immediately. Kexec boots the kernel to a controlled environment with the hardware already initialized. The risk of unsuccessful system start is minimized.
Saving the dump of a crashed kernel
Kexec preserves the contents of the physical memory. After the production kernel fails, the capture kernel, which runs in a reserved memory, saves the state of the failed kernel. The saved image can help you with the subsequent analysis.
Booting without GRUB or LILO configuration
When the system boots a kernel with Kexec, it skips the boot loader stage. Normal booting procedure can fail due to an error in the boot loader configuration. With Kexec, you do not depend on a working boot loader configuration.
18.2. Required Packages
If you aim to use Kexec on openSUSE® to speed up reboots or avoid
potential hardware problems, you need to install the
kexec-tools package.
The package kexec-tools contains a script called
kexec-bootloader. It reads the boot loader
configuration and runs Kexec with the same kernel options as the normal
boot loader does. kexec-bootloader -h
gives you the list of possible options.
To set up an environment that helps you obtain useful debug information
in case of a kernel crash, you need to install
makedumpfile in addition.
The preferred method to use Kdump in the SUSE environment is through
the YaST Kdump module. Install the package
yast2-kdump by entering zypper install
yast2-kdump in the command line as root.
18.3. Kexec Internals
The most important component of Kexec is the
/sbin/kexec command. You can load a kernel with
Kexec in two different ways:
With kexec
-lkernel_imageto load the kernel to the address space of a production kernel for regular reboot. You can later boot to this kernel with kexec-e.With kexec
-pkernel_imageto load the kernel to a reserved area of memory. This kernel will be booted automatically when the system crashes.
If you want to boot another kernel and preserve the data of the
production kernel when the system crashes, you need to reserve a
dedicated area of the system memory. The production kernel never loads to
this area because it must be available at all times. It is used for the
capture kernel so that the memory pages of the production kernel can be
preserved. You reserve the area with crashkernel =
size@offset as a command line parameter of the
production kernel. Note that this is not a parameter of the capture
kernel. The capture kernel does not use Kexec at all.
The capture kernel is loaded to the reserved area and waits for the kernel to crash. Then Kdump tries to invoke the capture kernel in the most simple way because the production kernel is no longer reliable at this stage. This means that even Kdump can fail.
To load the capture kernel, you need to include the kernel boot
parameters. Usually, the initial RAM file system is used for booting. You
can specify it with --initrd =
filename. With --append =
cmdline , you append options to the command
line of the kernel to boot. It is helpful to include the command line of
the production kernel if these options are necessary for the kernel to
boot. You can simply copy the command line with --append
= "$(cat /proc/cmdline)" or add more options
with --append = "$(cat /proc/cmdline)
more_options" .
You can always unload the previously loaded kernel. To unload a kernel
that was loaded with the -l option, use the
kexec -u command. To unload a crash
kernel loaded with the -p option, use kexec
-p -u command.
18.4. Basic Kexec Usage
To verify if your Kexec environment works properly, follow these steps:
Make sure no users are currently logged in and no important services are running on the system.
Log in as
root.Switch to runlevel 1 with telinit
1Load the new kernel to the address space of the production kernel with the following command:
kexec
-l/boot/vmlinuz--append="$(cat /proc/cmdline)"--initrd=/boot/initrdUnmount all mounted file systems except the root file system with umount
-a![[Important]](admon/important.png)
Unmounting Root Filesystem Unmounting all file systems will most likely produce a
device
      is busy
warning message. The root file system cannot be unmounted if the system is running. Ignore the warning.Remount the root file system in read-only mode:
mount
-oremount,ro /Initiate the reboot of the kernel that you loaded in Step 4 with kexec
-e
It is important to unmount the previously mounted disk volumes in
read-write mode. The reboot syscall acts immediately upon calling. Hard
drive volumes mounted in read-write mode neither synchronize nor unmount
automatically. The new kernel may find them “dirty”.
Read-only disk volumes and virtual file systems do not need to be
unmounted. Refer to /etc/mtab to determine which
file systems you need to unmount.
The new kernel previously loaded to the address space of the older kernel rewrites it and takes control immediately. It displays the usual start-up messages. When the new kernel boots, it skips all hardware and firmware checks. Make sure no warning messages appear. All the file systems are supposed to be clean if they had been unmounted.
18.5. How to Configure Kexec for Routine Reboots
Kexec is often used for frequent reboots. For example, if it takes a long time to run through the hardware detection routines or if the start-up is not reliable.
![[Note]](admon/note.png) | Rebooting with Kexec |
|---|---|
In previous versions of openSUSE®, you had to manually edit the
configuration file | |
Note that firmware as well as the boot loader are not used when the system reboots with Kexec. Any changes you make to the boot loader configuration will be ignored until the computer performs a hard reboot.
18.6. Basic Kdump Configuration
You can use Kdump to save kernel dumps. If the kernel crashes, it is useful to copy the memory image of the crashed environment on the file system. You can then debug the dump file to find the cause of the kernel crash. This is called “core dump” .
Kdump works similar to Kexec (seeChapter 18, Kexec and Kdump). The capture kernel is executed after the running production kernel crashes. The difference is that Kexec replaces the production kernel with the capture kernel. With Kdump, you still have access to the memory space of the crashed production kernel. You can save the memory snapshot of the crashed kernel in the environment of the Kdump kernel.
You can either configure Kdump manually or with YaST.
18.6.1. Manual Kdump Configuration
Kdump reads its configuration from the
/etc/sysconfig/kdump file. To make sure that Kdump
works on your system, its default configuration is sufficient. To use
Kdump with the default settings,follow these steps:
Append the following kernel command line option to your boot loader configuration, and reboot the system:
crashkernel=size@offsetYou can find the corresponding values for
sizeandoffsetin the following table:Table 18.1. Recommended Values for Additional Kernel Command Line Parameters
Architecture
Recommended value
i386 and x86-64
crashkernel=64M@16M
IA64
crashkernel=256M (small systems) or crashkernel=512M (larger systems)
ppc64
crashkernel=128M or crashkernel=256M (larger systems)
Enable Kdump init script:
chkconfig
boot.kdumponYou can edit the options in
/etc/sysconfig/kdump. Reading the comments will help you understand the meaning of individual options.Execute the init script once with rckdump
start, or reboot the system.
After configuring Kdump with the default values, check if it works as expected. Make sure that no users are currently logged in and no important services are running on your system. Then follow these steps:
Switch to runlevel 1 with telinit
1Unmount all the disk file systems except the root file system with umount
-aRemount the root file system in read-only mode: mount
-oremount,ro /Invoke “kernel panic” with the
procfsinterface to Magic SysRq keys:echo
c
      >/proc/sysrq-trigger
| The Size of Kernel Dumps |
|---|---|
The | |
The capture kernel boots and the crashed kernel memory snapshot is saved
to the file system. The save path is given by the
KDUMP_SAVEDIR option and it defaults to
/var/crash. If
KDUMP_IMMEDIATE_REBOOT is set to
yes , the system automatically reboots the production
kernel. Log in and check that the dump has been created under
/var/crash.
![[Warning]](admon/warning.png) | Screen Freezes in X11 Session |
|---|---|
When Kdump takes control and you are logged in an X11 session, the screen will freeze without any notice. Some Kdump activity can be still visible (for example, deformed messages of a booting kernel on the screen). Do not reset the computer because Kdump always needs some time to complete its task. | |
18.6.2. YaST Configuration
In order to configure Kdump with YaST, you need to install the
yast2-kdump package. Then either start the
module in the
category of YaST Control Center, or enter yast2 kdump in the
command line as root.
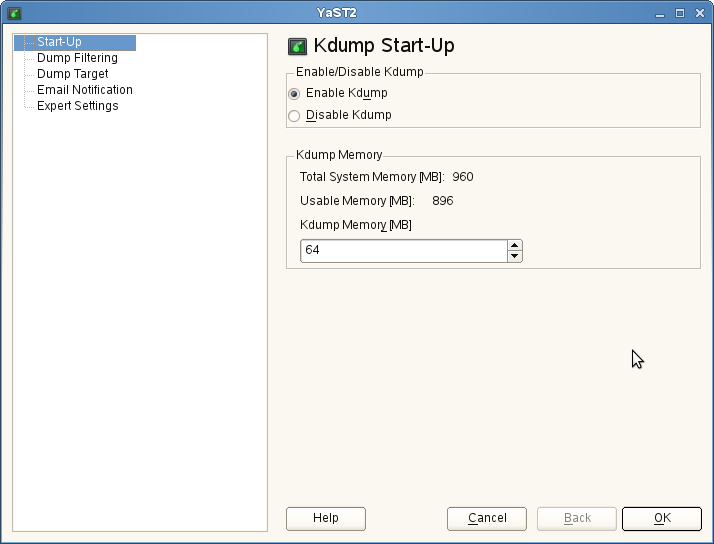
In the window, select . The default value for Kdump memory is sufficient on most systems.
Click in the left pane, and check what pages to include in the dump. You do not need to include the following memory content to be able to debug kernel problems:
Pages filled with zero
Cache pages
User data pages
Free pages
In the window, select the type of the dump target and the URL where you want to save the dump. If you selected a network protocol, such as FTP or SSH, you need to enter relevant access information as well.
Fill the window information if you want Kdump to inform you about its events via E-mail and confirm your changes with after fine tuning Kdump in the window. Kdump is now configured.
18.7. Analyzing the Crash Dump
After you obtain the dump, it is time to analyze it. There are several options.
The original tool to analyze the dumps is GDB. You can even use it in the latest environments, although it has several disadvantages and limitations:
GDB was not specifically designed to debug kernel dumps.
GDB does not support ELF64 binaries on 32-bit platforms.
GDB does not understand other formats than ELF dumps (it cannot debug compressed dumps).
That is why the crash utility was implemented. It analyzes crash dumps and debugs the running system as well. It provides functionality specific to debugging the Linux kernel and is much more suitable for advanced debugging.
If you want to debug the Linux kernel, you need to install its debugging information package in addition. Check if the package is installed on your system with zypper se kernel | grep debug.
| Repository for Packages with Debugging Information |
|---|---|
If you subscribed your system for online updates, you can find
“debuginfo” packages in the
| |
To open the captured dump in crash on the machine that
produced the dump, use a command like this:
crash /boot/vmlinux-2.6.32.8-0.1-default.gz /var/crash/2010-04-23-11\:17/vmcore
The first parameter represents the kernel image. The second parameter is
the dump file captured by Kdump. You can find this file under
/var/crash by default.
18.7.1. Kernel Binary Formats
The Linux kernel comes in Executable and Linkable Format (ELF). This
file is usually called vmlinux and is directly
generated in the compilation process. Not all boot loaders, especially
on x86 (i386 and x86_64) architecture, support ELF binaries. The
following solutions exist on different architectures supported by
openSUSE®.
18.7.1.1. x86 (i386 and x86_64)
Mostly for historic reasons, the Linux kernel consists of two parts:
the Linux kernel itself (vmlinux) and the setup code
run by the boot loader.
These two parts are linked together in a file called
bzImage, which can be found in the kernel source
tree. The file is now called vmlinuz (note
z vs. x) in the kernel package.
The ELF image is never directly used on x86. Therefore, the main kernel
package contains the vmlinux file in compressed
form called vmlinux.gz.
To sum it up, an x86 SUSE kernel package has two kernel files:
vmlinuzwhich is executed by the boot loader.vmlinux.gz, the compressed ELF image that is required by crash and GDB.
18.7.1.2. IA64
The elilo boot loader, which boots the Linux
kernel on the IA64 architecture, supports loading ELF images (even
compressed ones) out of the box. The IA64 kernel package contains only
one file called vmlinuz. It is a compressed ELF
image. vmlinuz on IA64 is the same as
vmlinux.gz on x86.
18.7.1.3. PPC and PPC64
The yaboot boot loader on PPC also supports
loading ELF images, but not compressed ones. In the PPC kernel package,
there is an ELF Linux kernel file vmlinux.
Considering crash, this is the easiest
architecture.
If you decide to analyze the dump on another machine, you must check both the architecture of the computer and the files necessary for debugging.
You can analyze the dump on another computer only if it runs a Linux
system of the same architecture. To check the compatibility, use the
command uname -i on both computers
and compare the outputs.
If you are going to analyze the dump on another computer, you also need
the appropriate files from the kernel and
kernel debug packages.
Put the kernel dump, the kernel image from
/boot, and its associated debugging info file from/usr/lib/debug/bootinto a single empty directory.Additionally, copy the kernel modules from
/lib/modules/$(uname -r)/kernel/and the associated debug info files from/usr/lib/debug/lib/modules/$(uname -r)/kernel/into a subdirectory namedmodules.In the directory with the dump, the kernel image, its debug info file, and the
modulessubdirectory, launch the crash utility: crashvmlinux-version vmcore.
| Support for Kernel Images |
|---|---|
Compressed kernel images (gzip, not the bzImage file) are supported by
SUSE packages of crash since openSUSE® 11. For older versions,
you have to extract the | |
Regardless of the computer on which you analyze the dump, the crash utility will produce an output similar to this:
tux@mercury:~> crash /boot/vmlinux-2.6.32.8-0.1-default.gz
/var/crash/2010-04-23-11\:17/vmcore

crash 4.0-7.6
Copyright (C) 2002, 2003, 2004, 2005, 2006, 2007, 2008  Red Hat, Inc.
Copyright (C) 2004, 2005, 2006  IBM Corporation
Copyright (C) 1999-2006  Hewlett-Packard Co
Copyright (C) 2005, 2006  Fujitsu Limited
Copyright (C) 2006, 2007  VA Linux Systems Japan K.K.
Copyright (C) 2005  NEC Corporation
Copyright (C) 1999, 2002, 2007  Silicon Graphics, Inc.
Copyright (C) 1999, 2000, 2001, 2002  Mission Critical Linux, Inc.
This program is free software, covered by the GNU General Public License,
and you are welcome to change it and/or distribute copies of it under
certain conditions.  Enter "help copying" to see the conditions.
This program has absolutely no warranty.  Enter "help warranty" for details.

GNU gdb 6.1
Copyright 2004 Free Software Foundation, Inc.
GDB is free software, covered by the GNU General Public License, and you are
welcome to change it and/or distribute copies of it under certain conditions.
Type "show copying" to see the conditions.
There is absolutely no warranty for GDB.  Type "show warranty" for details.
This GDB was configured as "x86_64-unknown-linux-gnu"...

      KERNEL: /boot/vmlinux-2.6.32.8-0.1-default.gz
   DEBUGINFO: /usr/lib/debug/boot/vmlinux-2.6.32.8-0.1-default.debug
    DUMPFILE: /var/crash/2009-04-23-11:17/vmcore
        CPUS: 2
        DATE: Thu Apr 23 13:17:01 2010
      UPTIME: 00:10:41
LOAD AVERAGE: 0.01, 0.09, 0.09
       TASKS: 42
    NODENAME: eros
     RELEASE: 2.6.32.8-0.1-default
     VERSION: #1 SMP 2010-03-31 14:50:44 +0200
     MACHINE: x86_64  (2999 Mhz)
      MEMORY: 1 GB
       PANIC: "SysRq : Trigger a crashdump"
         PID: 9446
     COMMAND: "bash"
        TASK: ffff88003a57c3c0  [THREAD_INFO: ffff880037168000]
         CPU: 1
       STATE: TASK_RUNNING (SYSRQ)
crash>
The command output prints first useful data: There were 42 tasks running at the moment of the kernel crash. The cause of the crash was a SysRq trigger invoked by the task with PID 9446. It was a Bash process because the echo that has been used is an internal command of the Bash shell.
The crash utility builds upon GDB and provides many useful additional commands. If you enter bt without any parameters, the backtrace of the task running at the moment of the crash is printed:
crash> bt
PID: 9446   TASK: ffff88003a57c3c0  CPU: 1   COMMAND: "bash"
 #0 [ffff880037169db0] crash_kexec at ffffffff80268fd6
 #1 [ffff880037169e80] __handle_sysrq at ffffffff803d50ed
 #2 [ffff880037169ec0] write_sysrq_trigger at ffffffff802f6fc5
 #3 [ffff880037169ed0] proc_reg_write at ffffffff802f068b
 #4 [ffff880037169f10] vfs_write at ffffffff802b1aba
 #5 [ffff880037169f40] sys_write at ffffffff802b1c1f
 #6 [ffff880037169f80] system_call_fastpath at ffffffff8020bfbb
    RIP: 00007fa958991f60  RSP: 00007fff61330390  RFLAGS: 00010246
    RAX: 0000000000000001  RBX: ffffffff8020bfbb  RCX: 0000000000000001
    RDX: 0000000000000002  RSI: 00007fa959284000  RDI: 0000000000000001
    RBP: 0000000000000002   R8: 00007fa9592516f0   R9: 00007fa958c209c0
    R10: 00007fa958c209c0  R11: 0000000000000246  R12: 00007fa958c1f780
    R13: 00007fa959284000  R14: 0000000000000002  R15: 00000000595569d0
    ORIG_RAX: 0000000000000001  CS: 0033  SS: 002b
crash>
Now it is clear what happened: The internal echo
command of Bash shell sent a character to
/proc/sysrq-trigger. After the corresponding
handler recognized this character, it invoked the
crash_kexec() function. This function called
panic() and Kdump saved a dump.
In addition to the basic GDB commands and the extended version of bt, the crash utility defines many other commands related to the structure of the Linux kernel. These commands understand the internal data structures of the Linux kernel and present their contents in a human readable format. For example, you can list the tasks running at the moment of the crash with ps. With sym, you can list all the kernel symbols with the corresponding addresses, or inquire an individual symbol for its value. With files, you can display all the open file descriptors of a process. With kmem, you can display details about the kernel memory usage. With vm, you can inspect the virtual memory of a process, even at the level of individual page mappings. The list of useful commands is very long and many of these accept a wide range of options.
The commands that we mentioned reflect the functionality of the common Linux commands, such as ps and lsof. If you would like to find out the exact sequence of events with the debugger, you need to know how to use GDB and to have strong debugging skills. Both of these are out of the scope of this document. In addition, you need to understand the Linux kernel. Several useful reference information sources are given at the end of this document.
18.8. Advanced Kdump Configuration
The configuration for Kdump is stored in
/etc/sysconfig/kdump. You can also use YaST to
configure it. Kdump configuration options are available under
+ in YaST Control Center. The following Kdump options may
be useful for you:
You can change the directory for the kernel dumps with the
KDUMP_SAVEDIR option. Keep in mind that the size of
kernel dumps can be very large. Kdump will refuse to save the dump if the
free disk space, subtracted by the estimated dump size, drops below the
value specified by the KDUMP_FREE_DISK_SIZE option. Note
that KDUMP_SAVEDIR understands URL format
protocol://specification, where
protocol is one of file,
ftp, sftp, nfs or
cifs, and specification varies for each
protocol. For example, to save kernel dump on an FTP server, use the
following URL as a template:
ftp://username:password@ftp.example.com:123/var/crash.
Kernel dumps are usually huge and contain many pages that are not
necessary for analysis. With KDUMP_DUMPLEVEL option,
you can omit such pages. The option understands numeric value between 0
and 31. If you specify 0, the dump size will
be largest. If you specify 31, it will produce
the smallest dump. For a complete table of possible values, see the
manual page of kdump (man 7 kdump).
Sometimes it is very useful to make the size of the kernel dump smaller.
For example, if you want to transfer the dump over the network, or if you
need to save some disk space in the dump directory. This can be done with
KDUMP_DUMPFORMAT set to
compressed. The crash
utility supports dynamic uncompression of the compressed dumps.
| Changes to Kdump Configuration File |
|---|---|
You always need to execute rckdump restart after you
make manual changes to | |
18.9. For More Information
Since there is no single comprehensive reference to Kexec and Kdump usage, you have to explore several resources to get the information you need. Here are some of them:
For the Kexec utility usage, see the manual page of Kexec.
You can find general information about Kexec at http://www.ibm.com/developerworks/linux/library/l-kexec.html . Might be slightly outdated.
For more details on Kdump specific to SUSE Linux, see http://ftp.suse.com/pub/people/tiwai/kdump-training/kdump-training.pdf .
An in-depth description of Kdump internals can be found at http://lse.sourceforge.net/kdump/documentation/ols2oo5-kdump-paper.pdf .
For more details on crash dump analysis and debugging tools, use the following resources:
Very useful information about kernel dump debugging with
crashcan be found at http://en.opensuse.org/Crashdump_Debugging .In addition to the info page of GDB (info gdb), you might want to read the printable guides at http://sourceware.org/gdb/documentation/ .
A white paper with a comprehensive description of the crash utility usage can be found at http://people.redhat.com/anderson/crash_whitepaper/ .
The crash utility also features a comprehensive online help. Just write help
commandto display the online help for command.If you have the necessary Perl skills, you can use Alicia to make the debugging easier. This Perl-based front end to the crash utility can be found at http://alicia.sourceforge.net/ .
If you prefer Python instead, you may want to install Pykdump. This package helps you control GDB through Python scripts and can be downloaded from http://sf.net/projects/pykdump .
A very comprehensive overview of the Linux kernel internals is given in Understanding the Linux Kernel by Daniel P. Bovet and Marco Cesati (ISBN 978-0-596-00565-8).